|
Download Data (XLS File) |
|
||||||||
|
||||||||
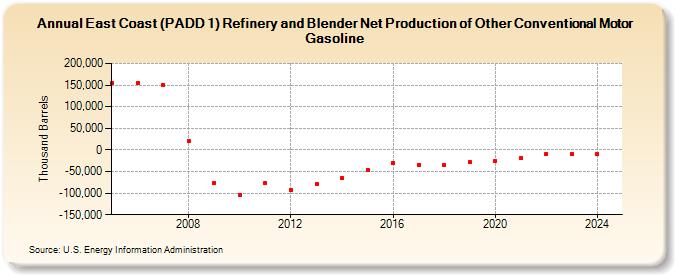
| East Coast (PADD 1) Refinery and Blender Net Production of Other Conventional Motor Gasoline (Thousand Barrels) | ||||||||
| Decade | Year-0 | Year-1 | Year-2 | Year-3 | Year-4 | Year-5 | Year-6 | Year-7 | Year-8 | Year-9 |
|---|---|---|---|---|---|---|---|---|---|---|
| 2000's | 154,257 | 155,668 | 150,614 | 20,543 | -76,764 | |||||
| 2010's | -103,347 | -76,828 | -92,612 | -79,082 | -63,906 | -46,093 | -30,468 | -34,290 | -35,707 | -28,458 |
| 2020's | -24,652 | -18,193 | -8,607 | -9,031 |
| - = No Data Reported; -- = Not Applicable; NA = Not Available; W = Withheld to avoid disclosure of individual company data. |
| Release Date: 3/29/2024 |
| Next Release Date: 8/30/2024 |