|
Download Data (XLS File) |
|
||||||||
|
||||||||
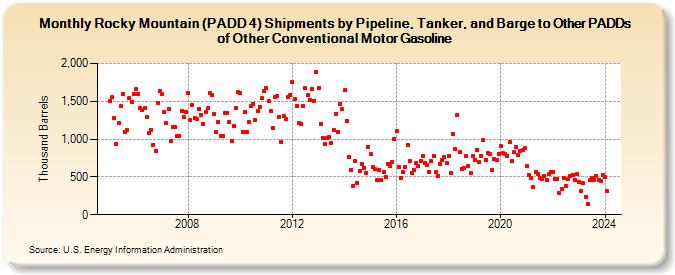
| Rocky Mountain (PADD 4) Shipments by Pipeline, Tanker, and Barge to Other PADDs of Other Conventional Motor Gasoline (Thousand Barrels) | ||||||||
| Year | Jan | Feb | Mar | Apr | May | Jun | Jul | Aug | Sep | Oct | Nov | Dec |
|---|---|---|---|---|---|---|---|---|---|---|---|---|
| 2005 | 1,501 | 1,556 | 1,283 | 937 | 1,209 | 1,434 | 1,590 | 1,098 | 1,125 | 1,540 | 1,484 | 1,595 |
| 2006 | 1,668 | 1,600 | 1,415 | 1,390 | 1,410 | 1,291 | 1,078 | 1,126 | 923 | 847 | 1,476 | 1,634 |
| 2007 | 1,602 | 1,364 | 1,208 | 1,401 | 971 | 1,163 | 1,163 | 1,041 | 1,043 | 1,370 | 1,291 | 1,362 |
| 2008 | 1,615 | 1,252 | 1,456 | 1,273 | 1,265 | 1,401 | 1,322 | 1,203 | 1,354 | 1,405 | 1,606 | 1,577 |
| 2009 | 1,326 | 1,092 | 1,223 | 1,045 | 1,036 | 1,341 | 1,350 | 1,232 | 979 | 1,168 | 1,408 | 1,619 |
| 2010 | 1,616 | 1,095 | 1,361 | 1,091 | 1,227 | 1,437 | 1,467 | 1,252 | 1,371 | 1,431 | 1,540 | 1,634 |
| 2011 | 1,682 | 1,500 | 1,366 | 1,151 | 1,563 | 1,569 | 1,297 | 964 | 1,311 | 1,266 | 1,553 | 1,588 |
| 2012 | 1,755 | 1,531 | 1,441 | 1,218 | 1,194 | 1,438 | 1,670 | 1,580 | 1,522 | 1,661 | 1,509 | 1,891 |
| 2013 | 1,678 | 1,194 | 1,021 | 932 | 1,010 | 1,030 | 952 | 1,115 | 1,337 | 1,094 | 1,468 | 1,392 |
| 2014 | 1,644 | 1,243 | 765 | 593 | 382 | 715 | 423 | 578 | 665 | 617 | 555 | 902 |
| 2015 | 797 | 634 | 598 | 459 | 585 | 457 | 560 | 501 | 671 | 640 | 697 | 1,007 |
| 2016 | 1,104 | 635 | 484 | 559 | 634 | 928 | 707 | 550 | 589 | 685 | 641 | 708 |
| 2017 | 770 | 688 | 661 | 571 | 706 | 782 | 562 | 506 | 675 | 724 | 766 | 688 |
| 2018 | 771 | 550 | 1,065 | 865 | 1,317 | 827 | 608 | 621 | 773 | 641 | 548 | 770 |
| 2019 | 720 | 861 | 701 | 782 | 994 | 728 | 814 | 804 | 594 | 735 | 723 | 804 |
| 2020 | 905 | 812 | 801 | 782 | 961 | 705 | 825 | 899 | 785 | 837 | 855 | 881 |
| 2021 | 640 | 528 | 490 | 365 | 568 | 533 | 488 | 471 | 509 | 462 | 535 | 568 |
| 2022 | 563 | 466 | 478 | 284 | 338 | 486 | 381 | 466 | 516 | 524 | 464 | 535 |
| 2023 | 430 | 320 | 414 | 231 | 147 | 456 | 485 | 453 | 516 | 461 | 444 | 525 |
| 2024 | 494 | |||||||||||
| - = No Data Reported; -- = Not Applicable; NA = Not Available; W = Withheld to avoid disclosure of individual company data. |
| Release Date: 3/29/2024 |
| Next Release Date: 4/30/2024 |
Referring Pages: