|
Download Data (XLS File) |
|
||||||||
|
||||||||
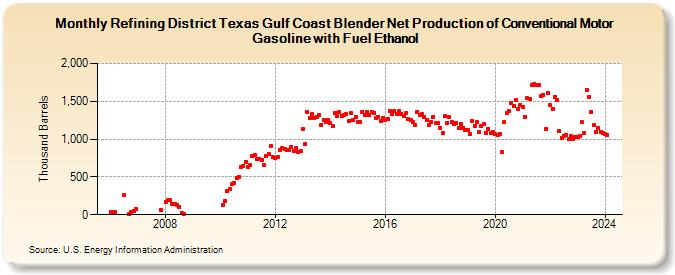
| Refining District Texas Gulf Coast Blender Net Production of Conventional Motor Gasoline with Fuel Ethanol (Thousand Barrels) | ||||||||
| Year | Jan | Feb | Mar | Apr | May | Jun | Jul | Aug | Sep | Oct | Nov | Dec |
|---|---|---|---|---|---|---|---|---|---|---|---|---|
| 2006 | 30 | 33 | 36 | 257 | 11 | 41 | 54 | 75 | ||||
| 2007 | 68 | |||||||||||
| 2008 | 170 | 189 | 189 | 138 | 147 | 134 | 103 | 24 | 10 | |||
| 2010 | 129 | 183 | 312 | 340 | 405 | 417 | 488 | 500 | 629 | 646 | 703 | |
| 2011 | 630 | 662 | 778 | 788 | 740 | 740 | 722 | 657 | 779 | 806 | 912 | 766 |
| 2012 | 754 | 758 | 862 | 881 | 870 | 857 | 856 | 898 | 837 | 876 | 835 | 841 |
| 2013 | 1,135 | 929 | 1,360 | 1,285 | 1,330 | 1,283 | 1,293 | 1,314 | 1,191 | 1,246 | 1,228 | 1,259 |
| 2014 | 1,207 | 1,169 | 1,346 | 1,307 | 1,359 | 1,301 | 1,315 | 1,328 | 1,239 | 1,343 | 1,250 | 1,297 |
| 2015 | 1,229 | 1,221 | 1,362 | 1,318 | 1,362 | 1,322 | 1,362 | 1,347 | 1,274 | 1,297 | 1,244 | 1,279 |
| 2016 | 1,251 | 1,268 | 1,377 | 1,336 | 1,376 | 1,335 | 1,368 | 1,337 | 1,312 | 1,341 | 1,267 | 1,255 |
| 2017 | 1,230 | 1,190 | 1,364 | 1,325 | 1,334 | 1,296 | 1,251 | 1,188 | 1,232 | 1,296 | 1,214 | 1,209 |
| 2018 | 1,143 | 1,085 | 1,301 | 1,216 | 1,297 | 1,221 | 1,200 | 1,218 | 1,144 | 1,197 | 1,149 | 1,126 |
| 2019 | 1,126 | 1,068 | 1,236 | 1,170 | 1,220 | 1,096 | 1,168 | 1,200 | 1,085 | 1,140 | 1,081 | 1,089 |
| 2020 | 1,066 | 1,059 | 1,074 | 825 | 1,226 | 1,346 | 1,374 | 1,479 | 1,433 | 1,516 | 1,404 | 1,445 |
| 2021 | 1,431 | 1,292 | 1,539 | 1,524 | 1,719 | 1,734 | 1,716 | 1,719 | 1,566 | 1,586 | 1,136 | 1,610 |
| 2022 | 1,446 | 1,395 | 1,552 | 1,522 | 1,103 | 1,015 | 1,038 | 1,059 | 1,000 | 1,040 | 1,005 | 1,022 |
| 2023 | 1,031 | 1,041 | 1,222 | 1,082 | 1,654 | 1,561 | 1,361 | 1,185 | 1,092 | 1,145 | 1,100 | 1,076 |
| 2024 | 1,062 | |||||||||||
| - = No Data Reported; -- = Not Applicable; NA = Not Available; W = Withheld to avoid disclosure of individual company data. |
| Release Date: 3/29/2024 |
| Next Release Date: 4/30/2024 |