|
Download Data (XLS File) |
|
||||||||
|
||||||||
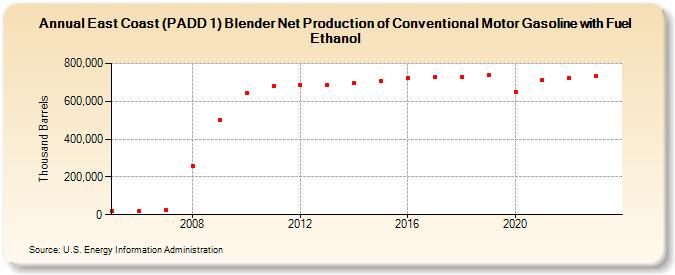
| East Coast (PADD 1) Blender Net Production of Conventional Motor Gasoline with Fuel Ethanol (Thousand Barrels) | ||||||||
| Decade | Year-0 | Year-1 | Year-2 | Year-3 | Year-4 | Year-5 | Year-6 | Year-7 | Year-8 | Year-9 |
|---|---|---|---|---|---|---|---|---|---|---|
| 2000's | 17,714 | 18,178 | 24,507 | 259,443 | 502,857 | |||||
| 2010's | 644,740 | 681,835 | 686,575 | 685,946 | 694,622 | 709,551 | 724,354 | 727,392 | 728,164 | 737,025 |
| 2020's | 649,800 | 714,855 | 724,924 | 733,262 |
| - = No Data Reported; -- = Not Applicable; NA = Not Available; W = Withheld to avoid disclosure of individual company data. |
| Release Date: 3/29/2024 |
| Next Release Date: 8/30/2024 |