|
Download Data (XLS File) |
|
||||||||
|
||||||||
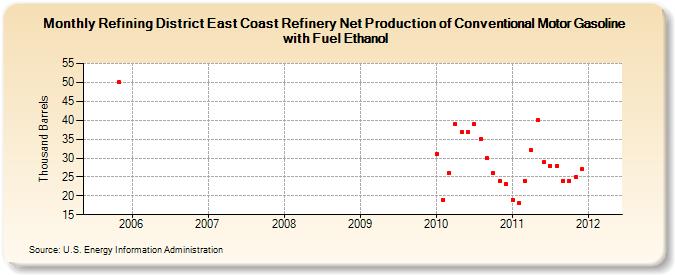
| Refining District East Coast Refinery Net Production of Conventional Motor Gasoline with Fuel Ethanol (Thousand Barrels) | ||||||||
| Year | Jan | Feb | Mar | Apr | May | Jun | Jul | Aug | Sep | Oct | Nov | Dec |
|---|---|---|---|---|---|---|---|---|---|---|---|---|
| 2005 | 50 | |||||||||||
| 2010 | 31 | 19 | 26 | 39 | 37 | 37 | 39 | 35 | 30 | 26 | 24 | 23 |
| 2011 | 19 | 18 | 24 | 32 | 40 | 29 | 28 | 28 | 24 | 24 | 25 | 27 |
| - = No Data Reported; -- = Not Applicable; NA = Not Available; W = Withheld to avoid disclosure of individual company data. |
| Release Date: 6/28/2024 |
| Next Release Date: 7/31/2024 |