|
Download Data (XLS File) |
|
||||||||
|
||||||||
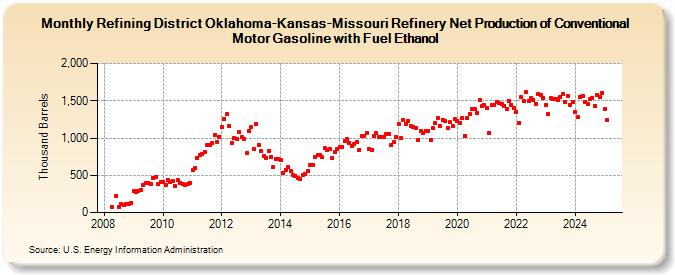
| Refining District Oklahoma-Kansas-Missouri Refinery Net Production of Conventional Motor Gasoline with Fuel Ethanol (Thousand Barrels) | ||||||||
| Year | Jan | Feb | Mar | Apr | May | Jun | Jul | Aug | Sep | Oct | Nov | Dec |
|---|---|---|---|---|---|---|---|---|---|---|---|---|
| 2008 | 72 | 228 | 80 | 112 | 108 | 117 | 114 | 130 | ||||
| 2009 | 286 | 274 | 290 | 307 | 369 | 397 | 400 | 380 | 468 | 474 | 377 | 405 |
| 2010 | 412 | 366 | 439 | 415 | 417 | 363 | 431 | 402 | 383 | 376 | 381 | 395 |
| 2011 | 565 | 594 | 738 | 774 | 779 | 813 | 903 | 911 | 931 | 1,045 | 947 | 1,019 |
| 2012 | 1,151 | 1,258 | 1,323 | 1,158 | 929 | 1,002 | 992 | 1,082 | 1,013 | 990 | 801 | 1,098 |
| 2013 | 1,144 | 854 | 1,182 | 910 | 823 | 756 | 736 | 825 | 752 | 605 | 720 | 712 |
| 2014 | 701 | 530 | 566 | 606 | 559 | 505 | 492 | 467 | 444 | 509 | 523 | 556 |
| 2015 | 632 | 638 | 749 | 767 | 774 | 743 | 861 | 840 | 856 | 732 | 812 | 854 |
| 2016 | 878 | 881 | 966 | 984 | 935 | 898 | 920 | 949 | 844 | 1,030 | 1,030 | 1,068 |
| 2017 | 858 | 843 | 1,027 | 1,061 | 1,014 | 1,018 | 1,014 | 1,052 | 1,053 | 910 | 940 | 1,008 |
| 2018 | 1,184 | 998 | 1,236 | 1,182 | 1,232 | 1,160 | 1,151 | 1,139 | 979 | 1,097 | 1,072 | 1,095 |
| 2019 | 1,091 | 973 | 1,129 | 1,200 | 1,269 | 1,167 | 1,248 | 1,230 | 1,130 | 1,214 | 1,155 | 1,255 |
| 2020 | 1,235 | 1,206 | 1,268 | 1,031 | 1,268 | 1,328 | 1,393 | 1,392 | 1,339 | 1,509 | 1,423 | 1,439 |
| 2021 | 1,405 | 1,063 | 1,442 | 1,446 | 1,485 | 1,470 | 1,450 | 1,436 | 1,394 | 1,498 | 1,447 | 1,398 |
| 2022 | 1,347 | 1,208 | 1,553 | 1,491 | 1,615 | 1,493 | 1,538 | 1,514 | 1,460 | 1,591 | 1,580 | 1,541 |
| 2023 | 1,446 | 1,321 | 1,532 | 1,523 | 1,525 | 1,509 | 1,555 | 1,592 | 1,481 | 1,563 | 1,443 | 1,485 |
| 2024 | 1,351 | |||||||||||
| - = No Data Reported; -- = Not Applicable; NA = Not Available; W = Withheld to avoid disclosure of individual company data. |
| Release Date: 3/29/2024 |
| Next Release Date: 4/30/2024 |