|
Download Data (XLS File) |
|
||||||||
|
||||||||
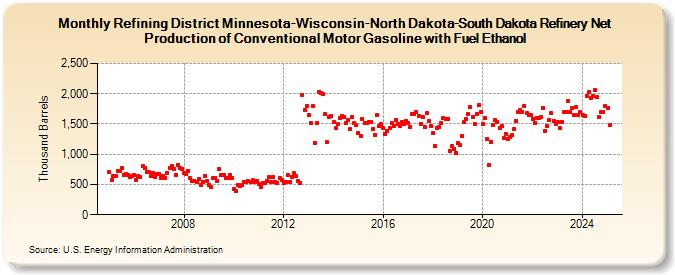
| Refining District Minnesota-Wisconsin-North Dakota-South Dakota Refinery Net Production of Conventional Motor Gasoline with Fuel Ethanol (Thousand Barrels) | ||||||||
| Year | Jan | Feb | Mar | Apr | May | Jun | Jul | Aug | Sep | Oct | Nov | Dec |
|---|---|---|---|---|---|---|---|---|---|---|---|---|
| 2005 | 704 | 573 | 648 | 643 | 719 | 729 | 768 | 663 | 671 | 658 | 624 | 643 |
| 2006 | 654 | 580 | 646 | 624 | 801 | 768 | 702 | 699 | 636 | 694 | 625 | 673 |
| 2007 | 681 | 615 | 643 | 608 | 696 | 779 | 800 | 755 | 661 | 830 | 775 | 757 |
| 2008 | 683 | 665 | 730 | 602 | 561 | 558 | 539 | 589 | 495 | 541 | 645 | 552 |
| 2009 | 489 | 455 | 599 | 613 | 560 | 755 | 656 | 652 | 599 | 612 | 657 | 613 |
| 2010 | 422 | 391 | 484 | 472 | 492 | 543 | 540 | 553 | 542 | 568 | 537 | 562 |
| 2011 | 515 | 461 | 531 | 527 | 555 | 622 | 542 | 624 | 542 | 520 | 602 | 574 |
| 2012 | 522 | 545 | 658 | 545 | 624 | 687 | 638 | 562 | 530 | 1,976 | 1,737 | 1,797 |
| 2013 | 1,656 | 1,513 | 1,790 | 1,186 | 1,515 | 2,029 | 2,009 | 1,995 | 1,662 | 1,196 | 1,615 | 1,628 |
| 2014 | 1,535 | 1,432 | 1,494 | 1,605 | 1,638 | 1,611 | 1,513 | 1,559 | 1,412 | 1,610 | 1,516 | 1,477 |
| 2015 | 1,353 | 1,309 | 1,579 | 1,513 | 1,522 | 1,535 | 1,531 | 1,425 | 1,321 | 1,646 | 1,468 | 1,504 |
| 2016 | 1,430 | 1,332 | 1,389 | 1,439 | 1,522 | 1,462 | 1,564 | 1,498 | 1,459 | 1,535 | 1,500 | 1,546 |
| 2017 | 1,524 | 1,457 | 1,669 | 1,668 | 1,704 | 1,631 | 1,503 | 1,623 | 1,445 | 1,677 | 1,543 | 1,474 |
| 2018 | 1,350 | 1,138 | 1,441 | 1,444 | 1,508 | 1,605 | 1,576 | 1,581 | 1,048 | 1,139 | 1,084 | 1,023 |
| 2019 | 1,178 | 1,152 | 1,299 | 1,527 | 1,585 | 1,661 | 1,783 | 1,619 | 1,498 | 1,660 | 1,810 | 1,693 |
| 2020 | 1,506 | 1,597 | 1,254 | 820 | 1,210 | 1,483 | 1,558 | 1,538 | 1,431 | 1,462 | 1,275 | 1,337 |
| 2021 | 1,255 | 1,286 | 1,321 | 1,420 | 1,554 | 1,704 | 1,729 | 1,698 | 1,802 | 1,685 | 1,652 | 1,653 |
| 2022 | 1,577 | 1,513 | 1,604 | 1,607 | 1,613 | 1,765 | 1,390 | 1,466 | 1,563 | 1,676 | 1,554 | 1,494 |
| 2023 | 1,530 | 1,433 | 1,538 | 1,701 | 1,703 | 1,881 | 1,706 | 1,763 | 1,644 | 1,774 | 1,642 | 1,691 |
| 2024 | 1,644 | 1,628 | 1,955 | 2,025 | ||||||||
| - = No Data Reported; -- = Not Applicable; NA = Not Available; W = Withheld to avoid disclosure of individual company data. |
| Release Date: 6/28/2024 |
| Next Release Date: 7/31/2024 |