|
Download Data (XLS File) |
|
||||||||
|
||||||||
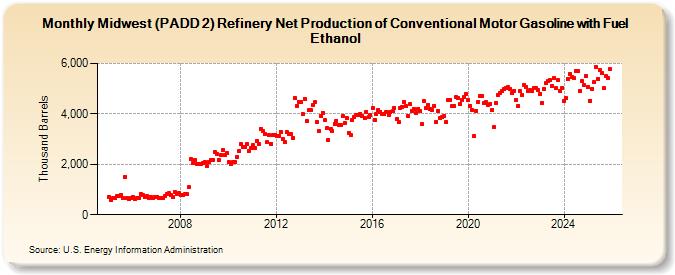
| Midwest (PADD 2) Refinery Net Production of Conventional Motor Gasoline with Fuel Ethanol (Thousand Barrels) | ||||||||
| Year | Jan | Feb | Mar | Apr | May | Jun | Jul | Aug | Sep | Oct | Nov | Dec |
|---|---|---|---|---|---|---|---|---|---|---|---|---|
| 2005 | 715 | 576 | 651 | 654 | 731 | 746 | 789 | 681 | 1,514 | 676 | 628 | 665 |
| 2006 | 710 | 615 | 663 | 674 | 825 | 773 | 710 | 727 | 652 | 722 | 661 | 707 |
| 2007 | 717 | 667 | 672 | 654 | 742 | 803 | 842 | 773 | 713 | 898 | 823 | 853 |
| 2008 | 766 | 765 | 805 | 815 | 1,080 | 2,208 | 2,049 | 2,174 | 2,016 | 1,994 | 2,004 | 2,050 |
| 2009 | 2,101 | 1,940 | 2,096 | 2,186 | 2,181 | 2,490 | 2,422 | 2,180 | 2,367 | 2,564 | 2,384 | 2,444 |
| 2010 | 2,083 | 1,996 | 2,087 | 2,087 | 2,286 | 2,508 | 2,806 | 2,696 | 2,685 | 2,798 | 2,547 | 2,639 |
| 2011 | 2,756 | 2,655 | 2,908 | 2,815 | 3,420 | 3,302 | 3,194 | 2,871 | 3,148 | 2,825 | 3,147 | 3,159 |
| 2012 | 3,128 | 3,135 | 3,293 | 2,991 | 2,872 | 3,267 | 3,189 | 3,221 | 3,056 | 4,621 | 4,314 | 4,485 |
| 2013 | 4,466 | 3,990 | 4,602 | 3,713 | 4,137 | 4,150 | 4,356 | 4,456 | 3,672 | 3,320 | 3,914 | 4,051 |
| 2014 | 3,755 | 3,425 | 2,965 | 3,412 | 3,341 | 3,595 | 3,733 | 3,569 | 3,543 | 3,907 | 3,642 | 3,842 |
| 2015 | 3,244 | 3,154 | 3,765 | 3,865 | 3,959 | 3,941 | 4,011 | 3,910 | 3,828 | 4,084 | 3,892 | 3,967 |
| 2016 | 4,226 | 3,775 | 3,977 | 4,161 | 4,079 | 3,998 | 3,978 | 4,090 | 3,975 | 4,073 | 4,114 | 4,228 |
| 2017 | 3,790 | 3,660 | 4,243 | 4,292 | 4,478 | 4,296 | 3,922 | 4,383 | 4,119 | 4,187 | 4,043 | 4,192 |
| 2018 | 4,098 | 3,595 | 4,510 | 4,252 | 4,364 | 4,213 | 4,151 | 4,331 | 3,690 | 4,121 | 3,838 | 3,879 |
| 2019 | 3,920 | 3,683 | 4,556 | 4,560 | 4,304 | 4,321 | 4,664 | 4,635 | 4,393 | 4,547 | 4,688 | 4,784 |
| 2020 | 4,549 | 4,329 | 4,164 | 3,122 | 4,126 | 4,481 | 4,718 | 4,700 | 4,446 | 4,454 | 4,364 | 4,398 |
| 2021 | 4,158 | 3,469 | 4,438 | 4,761 | 4,838 | 4,899 | 4,979 | 5,014 | 5,054 | 4,988 | 4,845 | 4,915 |
| 2022 | 4,556 | 4,332 | 4,898 | 4,732 | 5,133 | 5,063 | 4,911 | 4,929 | 4,919 | 5,029 | 5,019 | 4,941 |
| 2023 | 4,796 | 4,436 | 4,993 | 5,212 | 5,292 | 5,342 | 5,104 | 5,431 | 5,010 | 5,328 | 4,923 | 5,030 |
| 2024 | 4,514 | |||||||||||
| - = No Data Reported; -- = Not Applicable; NA = Not Available; W = Withheld to avoid disclosure of individual company data. |
| Release Date: 3/29/2024 |
| Next Release Date: 4/30/2024 |