|
Download Data (XLS File) |
|
||||||||
|
||||||||
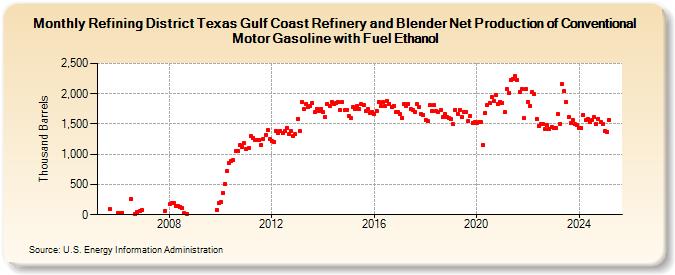
| Refining District Texas Gulf Coast Refinery and Blender Net Production of Conventional Motor Gasoline with Fuel Ethanol (Thousand Barrels) | ||||||||
| Year | Jan | Feb | Mar | Apr | May | Jun | Jul | Aug | Sep | Oct | Nov | Dec |
|---|---|---|---|---|---|---|---|---|---|---|---|---|
| 2005 | 91 | |||||||||||
| 2006 | 30 | 33 | 36 | 257 | 11 | 41 | 54 | 75 | ||||
| 2007 | 68 | |||||||||||
| 2008 | 170 | 189 | 189 | 138 | 147 | 134 | 103 | 24 | 10 | |||
| 2009 | 82 | 191 | ||||||||||
| 2010 | 203 | 365 | 510 | 724 | 858 | 893 | 897 | 1,057 | 1,059 | 1,146 | 1,120 | 1,183 |
| 2011 | 1,086 | 1,101 | 1,294 | 1,270 | 1,233 | 1,227 | 1,227 | 1,153 | 1,257 | 1,323 | 1,395 | 1,251 |
| 2012 | 1,219 | 1,208 | 1,387 | 1,349 | 1,382 | 1,357 | 1,376 | 1,438 | 1,334 | 1,383 | 1,308 | 1,327 |
| 2013 | 1,584 | 1,376 | 1,866 | 1,752 | 1,831 | 1,779 | 1,805 | 1,845 | 1,690 | 1,750 | 1,715 | 1,752 |
| 2014 | 1,692 | 1,609 | 1,836 | 1,794 | 1,868 | 1,822 | 1,842 | 1,867 | 1,725 | 1,857 | 1,725 | 1,736 |
| 2015 | 1,630 | 1,601 | 1,776 | 1,742 | 1,803 | 1,741 | 1,824 | 1,809 | 1,707 | 1,747 | 1,674 | 1,705 |
| 2016 | 1,669 | 1,718 | 1,863 | 1,797 | 1,861 | 1,802 | 1,885 | 1,838 | 1,776 | 1,799 | 1,693 | 1,699 |
| 2017 | 1,666 | 1,600 | 1,837 | 1,804 | 1,831 | 1,750 | 1,739 | 1,703 | 1,830 | 1,780 | 1,662 | 1,652 |
| 2018 | 1,573 | 1,542 | 1,808 | 1,708 | 1,813 | 1,711 | 1,704 | 1,729 | 1,609 | 1,669 | 1,620 | 1,595 |
| 2019 | 1,574 | 1,492 | 1,738 | 1,672 | 1,739 | 1,609 | 1,698 | 1,696 | 1,556 | 1,629 | 1,522 | 1,535 |
| 2020 | 1,512 | 1,528 | 1,527 | 1,145 | 1,689 | 1,811 | 1,845 | 1,942 | 1,874 | 1,981 | 1,830 | 1,868 |
| 2021 | 1,850 | 1,692 | 2,081 | 2,020 | 2,225 | 2,251 | 2,286 | 2,231 | 2,033 | 2,071 | 1,592 | 2,079 |
| 2022 | 1,869 | 1,802 | 2,027 | 1,989 | 1,590 | 1,466 | 1,492 | 1,495 | 1,421 | 1,476 | 1,415 | 1,452 |
| 2023 | 1,432 | 1,436 | 1,662 | 1,502 | 2,154 | 2,044 | 1,862 | 1,615 | 1,512 | 1,560 | 1,494 | 1,479 |
| 2024 | 1,439 | |||||||||||
| - = No Data Reported; -- = Not Applicable; NA = Not Available; W = Withheld to avoid disclosure of individual company data. |
| Release Date: 3/29/2024 |
| Next Release Date: 4/30/2024 |