|
Download Data (XLS File) |
|
||||||||
|
||||||||
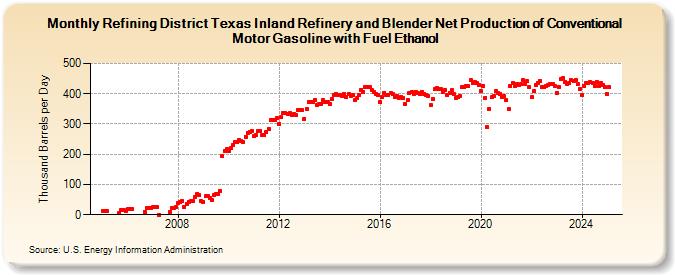
| Refining District Texas Inland Refinery and Blender Net Production of Conventional Motor Gasoline with Fuel Ethanol (Thousand Barrels per Day) | ||||||||
| Year | Jan | Feb | Mar | Apr | May | Jun | Jul | Aug | Sep | Oct | Nov | Dec |
|---|---|---|---|---|---|---|---|---|---|---|---|---|
| 2005 | 13 | 12 | 13 | 5 | 15 | 14 | 11 | |||||
| 2006 | 19 | 19 | 19 | 9 | 22 | 23 | 23 | |||||
| 2007 | 24 | 25 | 24 | 0 | 10 | 22 | 22 | 25 | ||||
| 2008 | 40 | 41 | 46 | 26 | 37 | 43 | 44 | 44 | 57 | 70 | 64 | 44 |
| 2009 | 43 | 61 | 63 | 55 | 50 | 64 | 68 | 67 | 78 | 194 | 212 | 216 |
| 2010 | 209 | 219 | 231 | 241 | 240 | 248 | 244 | 239 | 258 | 271 | 275 | 276 |
| 2011 | 260 | 263 | 276 | 276 | 262 | 262 | 273 | 284 | 312 | 313 | 313 | 320 |
| 2012 | 301 | 322 | 337 | 337 | 332 | 336 | 330 | 334 | 331 | 345 | 346 | 346 |
| 2013 | 317 | 351 | 372 | 372 | 371 | 378 | 362 | 367 | 367 | 378 | 373 | 374 |
| 2014 | 366 | 383 | 397 | 399 | 396 | 395 | 393 | 399 | 388 | 400 | 394 | 395 |
| 2015 | 378 | 385 | 396 | 412 | 406 | 421 | 423 | 422 | 411 | 405 | 400 | 395 |
| 2016 | 371 | 388 | 404 | 397 | 397 | 401 | 398 | 390 | 392 | 387 | 390 | 385 |
| 2017 | 365 | 379 | 403 | 407 | 400 | 407 | 401 | 400 | 407 | 400 | 396 | 392 |
| 2018 | 362 | 382 | 414 | 420 | 414 | 414 | 406 | 412 | 395 | 402 | 411 | 400 |
| 2019 | 386 | 388 | 394 | 421 | 421 | 426 | 425 | 444 | 435 | 439 | 434 | 429 |
| 2020 | 408 | 426 | 387 | 289 | 351 | 388 | 391 | 409 | 404 | 400 | 388 | 391 |
| 2021 | 378 | 349 | 424 | 436 | 426 | 433 | 428 | 431 | 445 | 433 | 441 | 421 |
| 2022 | 388 | 409 | 430 | 437 | 443 | 421 | 421 | 425 | 428 | 433 | 432 | 426 |
| 2023 | 406 | 423 | 450 | 452 | 439 | 438 | 438 | 444 | 443 | 445 | 430 | 412 |
| 2024 | 396 | |||||||||||
| - = No Data Reported; -- = Not Applicable; NA = Not Available; W = Withheld to avoid disclosure of individual company data. |
| Release Date: 3/29/2024 |
| Next Release Date: 4/30/2024 |