|
Download Data (XLS File) |
|
||||||||
|
||||||||
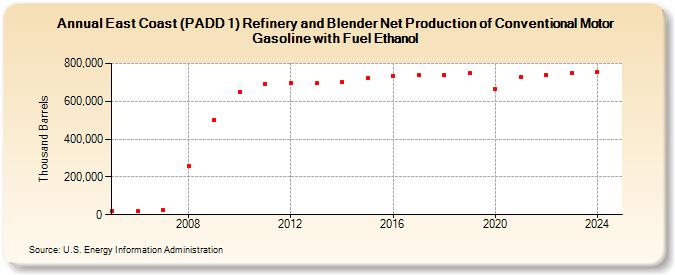
| East Coast (PADD 1) Refinery and Blender Net Production of Conventional Motor Gasoline with Fuel Ethanol (Thousand Barrels) | ||||||||
| Decade | Year-0 | Year-1 | Year-2 | Year-3 | Year-4 | Year-5 | Year-6 | Year-7 | Year-8 | Year-9 |
|---|---|---|---|---|---|---|---|---|---|---|
| 2000's | 17,764 | 18,178 | 24,507 | 259,443 | 502,857 | |||||
| 2010's | 648,273 | 692,498 | 697,659 | 696,491 | 704,561 | 721,173 | 735,860 | 738,674 | 739,780 | 750,743 |
| 2020's | 663,788 | 728,047 | 737,229 | 747,205 |
| - = No Data Reported; -- = Not Applicable; NA = Not Available; W = Withheld to avoid disclosure of individual company data. |
| Release Date: 3/29/2024 |
| Next Release Date: 8/30/2024 |