|
Download Data (XLS File) |
|
||||||||
|
||||||||
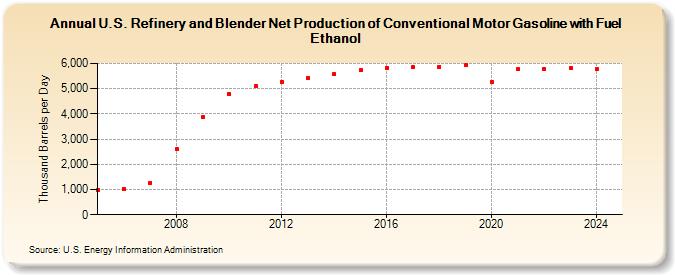
| U.S. Refinery and Blender Net Production of Conventional Motor Gasoline with Fuel Ethanol (Thousand Barrels per Day) | ||||||||
| Decade | Year-0 | Year-1 | Year-2 | Year-3 | Year-4 | Year-5 | Year-6 | Year-7 | Year-8 | Year-9 |
|---|---|---|---|---|---|---|---|---|---|---|
| 2000's | 961 | 1,018 | 1,271 | 2,597 | 3,884 | |||||
| 2010's | 4,787 | 5,097 | 5,284 | 5,443 | 5,584 | 5,741 | 5,839 | 5,851 | 5,873 | 5,927 |
| 2020's | 5,278 | 5,767 | 5,773 | 5,809 |
| - = No Data Reported; -- = Not Applicable; NA = Not Available; W = Withheld to avoid disclosure of individual company data. |
| Release Date: 3/29/2024 |
| Next Release Date: 8/30/2024 |