|
Download Data (XLS File) |
|
||||||||
|
||||||||
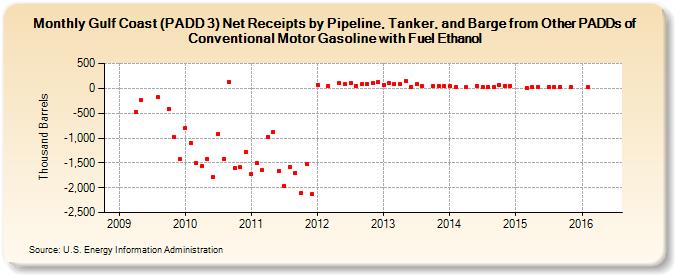
| Gulf Coast (PADD 3) Net Receipts by Pipeline, Tanker, and Barge from Other PADDs of Conventional Motor Gasoline with Fuel Ethanol (Thousand Barrels) | ||||||||
| Year | Jan | Feb | Mar | Apr | May | Jun | Jul | Aug | Sep | Oct | Nov | Dec |
|---|---|---|---|---|---|---|---|---|---|---|---|---|
| 2009 | -478 | -229 | -176 | -407 | -979 | -1,432 | ||||||
| 2010 | -796 | -1,103 | -1,505 | -1,567 | -1,422 | -1,787 | -913 | -1,427 | 127 | -1,600 | -1,592 | -1,273 |
| 2011 | -1,723 | -1,512 | -1,648 | -970 | -886 | -1,665 | -1,960 | -1,574 | -1,700 | -2,113 | -1,524 | -2,135 |
| 2012 | 77 | 37 | 115 | 81 | 108 | 47 | 82 | 83 | 100 | 127 | ||
| 2013 | 74 | 110 | 87 | 80 | 145 | 28 | 86 | 50 | 45 | 46 | 37 | |
| 2014 | 53 | 20 | 25 | 50 | 25 | 30 | 29 | 63 | 54 | 53 | ||
| 2015 | 15 | 26 | 31 | 28 | 25 | 24 | 21 | |||||
| 2016 | 20 | |||||||||||
| - = No Data Reported; -- = Not Applicable; NA = Not Available; W = Withheld to avoid disclosure of individual company data. |
| Release Date: 3/29/2024 |
| Next Release Date: 4/30/2024 |
Referring Pages: