|
Download Data (XLS File) |
|
||||||||
|
||||||||
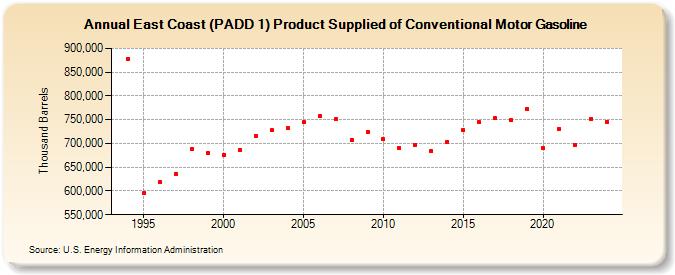
| East Coast (PADD 1) Product Supplied of Conventional Motor Gasoline (Thousand Barrels) | ||||||||
| Decade | Year-0 | Year-1 | Year-2 | Year-3 | Year-4 | Year-5 | Year-6 | Year-7 | Year-8 | Year-9 |
|---|---|---|---|---|---|---|---|---|---|---|
| 1990's | NA | 878,053 | 594,990 | 617,966 | 636,104 | 689,261 | 679,413 | |||
| 2000's | 675,238 | 687,105 | 716,131 | 728,086 | 731,945 | 744,912 | 757,200 | 750,394 | 707,954 | 723,599 |
| 2010's | 708,325 | 689,929 | 697,682 | 683,594 | 703,463 | 728,129 | 744,408 | 752,584 | 749,787 | 772,683 |
| 2020's | 689,722 | 731,242 | 697,068 | 752,414 |
| - = No Data Reported; -- = Not Applicable; NA = Not Available; W = Withheld to avoid disclosure of individual company data. |
| Release Date: 6/28/2024 |
| Next Release Date: 8/30/2024 |