|
Download Data (XLS File) |
|
||||||||
|
||||||||
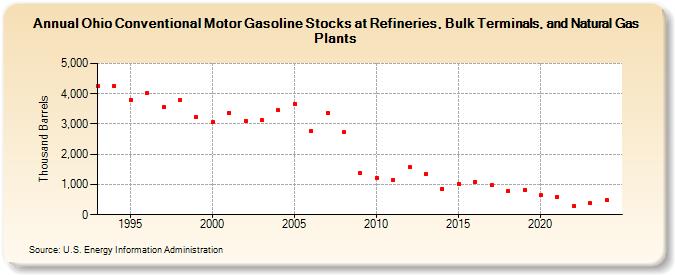
| Ohio Conventional Motor Gasoline Stocks at Refineries, Bulk Terminals, and Natural Gas Plants (Thousand Barrels) | ||||||||
| Decade | Year-0 | Year-1 | Year-2 | Year-3 | Year-4 | Year-5 | Year-6 | Year-7 | Year-8 | Year-9 |
|---|---|---|---|---|---|---|---|---|---|---|
| 1990's | 4,259 | 4,248 | 3,801 | 4,010 | 3,557 | 3,779 | 3,218 | |||
| 2000's | 3,057 | 3,374 | 3,107 | 3,117 | 3,451 | 3,674 | 2,765 | 3,364 | 2,724 | 1,373 |
| 2010's | 1,229 | 1,145 | 1,564 | 1,350 | 862 | 1,006 | 1,093 | 970 | 787 | 821 |
| 2020's | 643 | 592 | 280 | 385 |
| - = No Data Reported; -- = Not Applicable; NA = Not Available; W = Withheld to avoid disclosure of individual company data. |
| Release Date: 3/29/2024 |
| Next Release Date: 8/30/2024 |