|
Download Data (XLS File) |
|
||||||||
|
||||||||
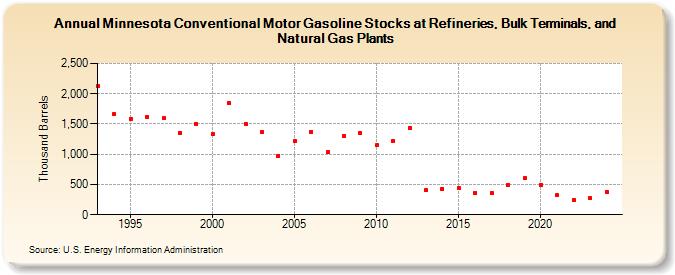
| Minnesota Conventional Motor Gasoline Stocks at Refineries, Bulk Terminals, and Natural Gas Plants (Thousand Barrels) | ||||||||
| Decade | Year-0 | Year-1 | Year-2 | Year-3 | Year-4 | Year-5 | Year-6 | Year-7 | Year-8 | Year-9 |
|---|---|---|---|---|---|---|---|---|---|---|
| 1990's | 2,127 | 1,663 | 1,588 | 1,617 | 1,592 | 1,357 | 1,501 | |||
| 2000's | 1,330 | 1,843 | 1,501 | 1,368 | 976 | 1,212 | 1,374 | 1,032 | 1,305 | 1,349 |
| 2010's | 1,145 | 1,217 | 1,437 | 404 | 432 | 434 | 359 | 363 | 498 | 601 |
| 2020's | 499 | 318 | 251 | 273 |
| - = No Data Reported; -- = Not Applicable; NA = Not Available; W = Withheld to avoid disclosure of individual company data. |
| Release Date: 3/29/2024 |
| Next Release Date: 8/30/2024 |