|
Download Data (XLS File) |
|
||||||||
|
||||||||
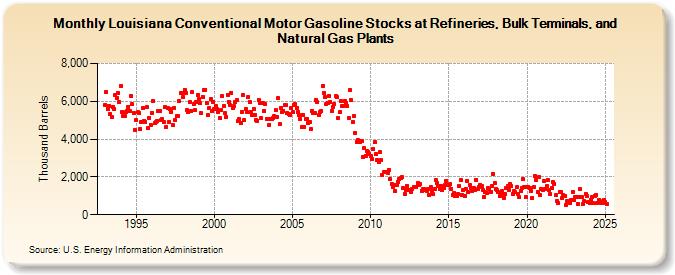
| Louisiana Conventional Motor Gasoline Stocks at Refineries, Bulk Terminals, and Natural Gas Plants (Thousand Barrels) | ||||||||
| Year | Jan | Feb | Mar | Apr | May | Jun | Jul | Aug | Sep | Oct | Nov | Dec |
|---|---|---|---|---|---|---|---|---|---|---|---|---|
| 1993 | 5,811 | 6,482 | 5,607 | 5,776 | 5,336 | 5,154 | 5,718 | 5,606 | 6,318 | 6,192 | 6,439 | 5,955 |
| 1994 | 6,817 | 5,456 | 5,224 | 5,224 | 5,424 | 5,480 | 5,720 | 5,494 | 6,287 | 5,843 | 5,392 | 4,476 |
| 1995 | 5,032 | 5,407 | 5,369 | 4,543 | 4,919 | 5,657 | 4,958 | 4,910 | 5,674 | 4,581 | 5,120 | 4,751 |
| 1996 | 5,395 | 5,999 | 4,861 | 4,896 | 4,976 | 5,463 | 5,479 | 5,006 | 5,039 | 4,880 | 5,686 | 4,629 |
| 1997 | 5,654 | 4,917 | 5,583 | 5,429 | 4,755 | 5,664 | 4,998 | 5,206 | 5,225 | 6,003 | 6,415 | 6,450 |
| 1998 | 6,247 | 6,600 | 6,441 | 5,524 | 5,422 | 5,940 | 5,498 | 6,472 | 5,849 | 5,543 | 5,960 | 6,335 |
| 1999 | 6,118 | 5,899 | 5,360 | 6,248 | 6,596 | 6,615 | 5,909 | 5,256 | 5,622 | 6,121 | 5,499 | 5,981 |
| 2000 | 5,590 | 5,746 | 5,598 | 5,411 | 5,127 | 5,523 | 6,268 | 5,734 | 5,375 | 5,171 | 6,325 | 5,964 |
| 2001 | 5,789 | 6,457 | 5,651 | 5,733 | 5,961 | 6,055 | 4,953 | 5,046 | 4,840 | 5,446 | 6,334 | 4,997 |
| 2002 | 5,578 | 5,418 | 6,239 | 5,971 | 5,435 | 5,299 | 5,598 | 5,262 | 5,017 | 4,983 | 6,043 | 5,886 |
| 2003 | 5,118 | 5,923 | 5,490 | 5,848 | 5,058 | 5,048 | 4,758 | 5,074 | 5,060 | 5,114 | 5,207 | 5,527 |
| 2004 | 5,193 | 6,149 | 4,784 | 5,656 | 5,409 | 5,500 | 5,796 | 5,778 | 5,377 | 5,311 | 5,268 | 5,654 |
| 2005 | 5,422 | 5,809 | 5,842 | 5,652 | 5,429 | 5,295 | 5,060 | 4,643 | 5,287 | 4,641 | 5,085 | 5,080 |
| 2006 | 4,834 | 4,906 | 4,537 | 5,508 | 5,402 | 5,403 | 6,044 | 5,966 | 5,250 | 5,425 | 5,491 | 6,802 |
| 2007 | 6,458 | 6,246 | 5,869 | 5,914 | 6,283 | 5,965 | 5,460 | 5,717 | 5,845 | 6,284 | 6,206 | 5,141 |
| 2008 | 5,422 | 6,030 | 5,746 | 5,743 | 6,002 | 5,923 | 5,737 | 5,091 | 6,604 | 6,048 | 4,908 | 5,201 |
| 2009 | 4,335 | 3,864 | 3,958 | 3,893 | 3,833 | 3,919 | 3,076 | 3,518 | 3,121 | 3,386 | 3,334 | 3,223 |
| 2010 | 3,086 | 2,957 | 3,461 | 3,829 | 3,188 | 2,893 | 2,785 | 3,298 | 2,879 | 2,106 | 2,240 | 2,281 |
| 2011 | 2,267 | 2,211 | 2,389 | 1,875 | 1,647 | 1,482 | 1,553 | 1,234 | 1,571 | 1,732 | 1,891 | 1,922 |
| 2012 | 1,972 | 1,405 | 1,100 | 1,314 | 1,529 | 1,307 | 1,283 | 1,182 | 1,363 | 1,444 | 1,444 | 1,448 |
| 2013 | 1,670 | 1,597 | 1,637 | 1,272 | 1,336 | 1,341 | 1,328 | 1,269 | 1,364 | 1,056 | 1,485 | 1,276 |
| 2014 | 1,074 | 1,347 | 1,823 | 1,676 | 1,535 | 1,336 | 1,510 | 1,286 | 1,404 | 1,574 | 1,802 | 1,586 |
| 2015 | 1,551 | 1,606 | 1,379 | 1,029 | 1,150 | 982 | 988 | 1,102 | 1,505 | 1,839 | 1,046 | 1,293 |
| 2016 | 982 | 1,351 | 1,787 | 1,179 | 1,555 | 1,433 | 1,266 | 1,411 | 1,288 | 1,858 | 1,339 | 1,488 |
| 2017 | 1,593 | 1,510 | 1,324 | 959 | 1,178 | 1,175 | 1,387 | 1,350 | 1,214 | 1,512 | 2,147 | 1,662 |
| 2018 | 1,380 | 1,291 | 1,199 | 984 | 1,120 | 1,240 | 906 | 1,070 | 1,411 | 1,511 | 1,315 | 1,623 |
| 2019 | 1,516 | 1,103 | 1,239 | 1,187 | 1,448 | 1,087 | 945 | 1,257 | 1,399 | 1,888 | 1,486 | 923 |
| 2020 | 1,482 | 1,468 | 1,397 | 1,248 | 896 | 1,451 | 2,036 | 1,829 | 1,208 | 1,987 | 1,030 | 1,383 |
| 2021 | 1,297 | 1,781 | 1,383 | 1,493 | 1,820 | 1,322 | 1,092 | 1,423 | 1,712 | 1,641 | 1,022 | 731 |
| 2022 | 646 | 1,204 | 1,204 | 864 | 1,044 | 975 | 528 | 744 | 650 | 594 | 771 | 1,206 |
| 2023 | 759 | 946 | 919 | 583 | 937 | 1,334 | 945 | 581 | 709 | 1,103 | 976 | 679 |
| 2024 | 605 | |||||||||||
| - = No Data Reported; -- = Not Applicable; NA = Not Available; W = Withheld to avoid disclosure of individual company data. |
| Release Date: 3/29/2024 |
| Next Release Date: 4/30/2024 |