|
Download Data (XLS File) |
|
||||||||
|
||||||||
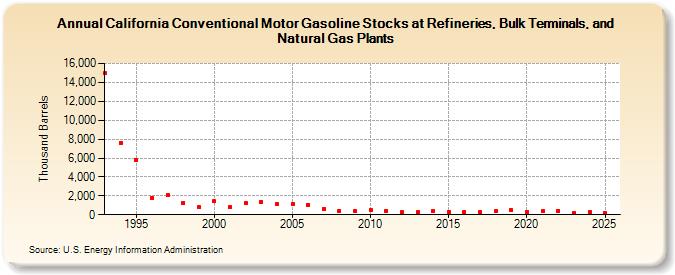
| California Conventional Motor Gasoline Stocks at Refineries, Bulk Terminals, and Natural Gas Plants (Thousand Barrels) | ||||||||
| Decade | Year-0 | Year-1 | Year-2 | Year-3 | Year-4 | Year-5 | Year-6 | Year-7 | Year-8 | Year-9 |
|---|---|---|---|---|---|---|---|---|---|---|
| 1990's | 14,966 | 7,587 | 5,778 | 1,809 | 2,076 | 1,289 | 797 | |||
| 2000's | 1,405 | 812 | 1,204 | 1,378 | 1,087 | 1,164 | 1,072 | 636 | 442 | 388 |
| 2010's | 514 | 443 | 271 | 251 | 441 | 290 | 294 | 270 | 358 | 496 |
| 2020's | 314 | 372 | 442 | 226 |
| - = No Data Reported; -- = Not Applicable; NA = Not Available; W = Withheld to avoid disclosure of individual company data. |
| Release Date: 6/28/2024 |
| Next Release Date: 8/30/2024 |