|
Download Data (XLS File) |
|
||||||||
|
||||||||
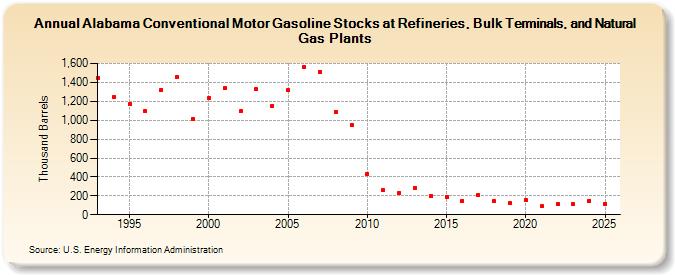
| Alabama Conventional Motor Gasoline Stocks at Refineries, Bulk Terminals, and Natural Gas Plants (Thousand Barrels) | ||||||||
| Decade | Year-0 | Year-1 | Year-2 | Year-3 | Year-4 | Year-5 | Year-6 | Year-7 | Year-8 | Year-9 |
|---|---|---|---|---|---|---|---|---|---|---|
| 1990's | 1,451 | 1,248 | 1,168 | 1,093 | 1,322 | 1,454 | 1,017 | |||
| 2000's | 1,236 | 1,338 | 1,092 | 1,329 | 1,153 | 1,318 | 1,559 | 1,514 | 1,090 | 951 |
| 2010's | 433 | 261 | 230 | 283 | 198 | 191 | 148 | 205 | 142 | 123 |
| 2020's | 155 | 88 | 112 | 110 |
| - = No Data Reported; -- = Not Applicable; NA = Not Available; W = Withheld to avoid disclosure of individual company data. |
| Release Date: 8/30/2024 |
| Next Release Date: 8/29/2025 |