|
Download Data (XLS File) |
|
||||||||
|
||||||||
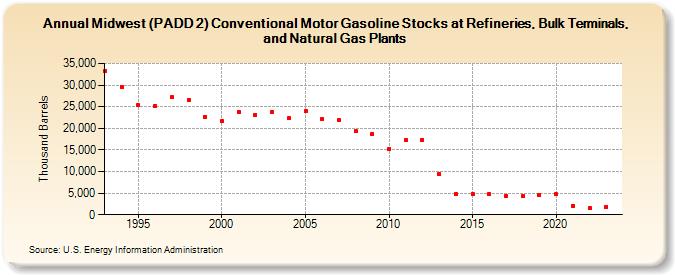
| Midwest (PADD 2) Conventional Motor Gasoline Stocks at Refineries, Bulk Terminals, and Natural Gas Plants (Thousand Barrels) | ||||||||
| Decade | Year-0 | Year-1 | Year-2 | Year-3 | Year-4 | Year-5 | Year-6 | Year-7 | Year-8 | Year-9 |
|---|---|---|---|---|---|---|---|---|---|---|
| 1990's | 33,350 | 29,664 | 25,339 | 25,172 | 27,157 | 26,640 | 22,677 | |||
| 2000's | 21,715 | 23,796 | 23,185 | 23,779 | 22,269 | 23,995 | 22,184 | 21,858 | 19,282 | 18,709 |
| 2010's | 15,162 | 17,199 | 17,372 | 9,370 | 4,777 | 4,807 | 4,692 | 4,342 | 4,294 | 4,584 |
| 2020's | 4,730 | 2,081 | 1,498 | 1,854 |
| - = No Data Reported; -- = Not Applicable; NA = Not Available; W = Withheld to avoid disclosure of individual company data. |
| Release Date: 6/28/2024 |
| Next Release Date: 8/30/2024 |