|
Download Data (XLS File) |
|
||||||||
|
||||||||
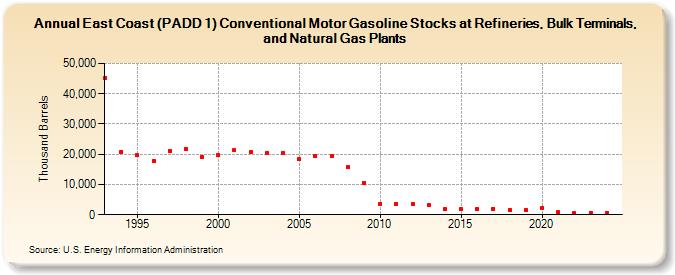
| East Coast (PADD 1) Conventional Motor Gasoline Stocks at Refineries, Bulk Terminals, and Natural Gas Plants (Thousand Barrels) | ||||||||
| Decade | Year-0 | Year-1 | Year-2 | Year-3 | Year-4 | Year-5 | Year-6 | Year-7 | Year-8 | Year-9 |
|---|---|---|---|---|---|---|---|---|---|---|
| 1990's | 45,292 | 20,874 | 19,707 | 17,864 | 21,088 | 21,652 | 19,238 | |||
| 2000's | 19,633 | 21,306 | 20,630 | 20,439 | 20,339 | 18,298 | 19,336 | 19,546 | 15,828 | 10,612 |
| 2010's | 3,672 | 3,577 | 3,485 | 3,159 | 1,759 | 1,885 | 1,812 | 2,045 | 1,497 | 1,528 |
| 2020's | 2,362 | 752 | 540 | 731 |
| - = No Data Reported; -- = Not Applicable; NA = Not Available; W = Withheld to avoid disclosure of individual company data. |
| Release Date: 6/28/2024 |
| Next Release Date: 8/30/2024 |