|
Download Data (XLS File) |
|
||||||||
|
||||||||
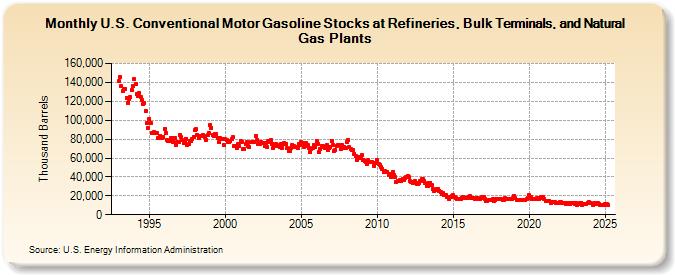
| U.S. Conventional Motor Gasoline Stocks at Refineries, Bulk Terminals, and Natural Gas Plants (Thousand Barrels) | ||||||||
| Year | Jan | Feb | Mar | Apr | May | Jun | Jul | Aug | Sep | Oct | Nov | Dec |
|---|---|---|---|---|---|---|---|---|---|---|---|---|
| 1993 | 140,965 | 145,557 | 135,815 | 130,662 | 132,777 | 132,950 | 123,764 | 118,299 | 121,900 | 124,548 | 131,909 | 136,145 |
| 1994 | 143,280 | 138,237 | 127,435 | 126,021 | 128,498 | 124,889 | 121,235 | 116,864 | 117,981 | 109,858 | 96,629 | 91,328 |
| 1995 | 101,667 | 97,499 | 86,637 | 86,971 | 87,439 | 86,901 | 86,401 | 80,662 | 83,782 | 81,623 | 81,601 | 82,644 |
| 1996 | 90,758 | 86,845 | 79,440 | 77,920 | 78,216 | 81,176 | 80,799 | 76,954 | 81,435 | 73,277 | 76,589 | 77,130 |
| 1997 | 83,857 | 81,882 | 78,729 | 75,346 | 76,481 | 80,599 | 73,867 | 74,637 | 77,564 | 77,744 | 80,129 | 82,602 |
| 1998 | 89,355 | 90,206 | 84,367 | 81,412 | 82,896 | 83,285 | 84,222 | 82,921 | 82,529 | 79,326 | 83,926 | 86,585 |
| 1999 | 94,822 | 92,199 | 84,029 | 83,000 | 85,847 | 84,977 | 81,661 | 77,153 | 81,042 | 80,123 | 79,956 | 73,689 |
| 2000 | 79,773 | 78,566 | 77,400 | 77,103 | 77,916 | 79,890 | 81,798 | 72,866 | 72,625 | 71,092 | 74,965 | 72,945 |
| 2001 | 77,587 | 77,163 | 69,217 | 69,832 | 74,471 | 77,189 | 72,298 | 71,301 | 76,687 | 77,209 | 77,431 | 77,253 |
| 2002 | 83,170 | 79,452 | 74,513 | 75,098 | 76,900 | 76,228 | 76,143 | 72,856 | 76,125 | 71,787 | 77,989 | 77,426 |
| 2003 | 78,671 | 75,169 | 70,288 | 73,126 | 74,995 | 73,931 | 72,950 | 71,845 | 74,432 | 70,604 | 75,392 | 74,449 |
| 2004 | 74,840 | 70,058 | 67,690 | 67,474 | 70,842 | 73,771 | 72,341 | 71,873 | 71,226 | 70,838 | 75,016 | 73,710 |
| 2005 | 77,386 | 76,036 | 71,928 | 72,929 | 76,019 | 74,274 | 70,852 | 65,923 | 69,655 | 70,607 | 74,154 | 71,802 |
| 2006 | 77,677 | 75,197 | 66,876 | 69,314 | 72,724 | 72,447 | 71,829 | 70,863 | 73,574 | 68,404 | 71,021 | 71,402 |
| 2007 | 78,495 | 73,992 | 67,498 | 68,266 | 72,835 | 73,773 | 73,274 | 69,332 | 73,705 | 70,098 | 71,823 | 70,660 |
| 2008 | 77,166 | 78,636 | 71,410 | 69,617 | 68,923 | 68,981 | 64,666 | 61,980 | 58,198 | 60,871 | 60,325 | 61,030 |
| 2009 | 62,663 | 57,911 | 56,909 | 56,248 | 53,971 | 57,883 | 55,888 | 55,880 | 55,970 | 51,969 | 54,812 | 54,890 |
| 2010 | 58,003 | 53,576 | 52,949 | 50,255 | 48,845 | 45,070 | 46,044 | 45,378 | 45,445 | 42,447 | 42,727 | 40,279 |
| 2011 | 44,928 | 42,497 | 39,682 | 34,971 | 35,851 | 36,044 | 36,260 | 35,867 | 37,282 | 36,883 | 39,303 | 39,542 |
| 2012 | 41,247 | 39,554 | 35,352 | 34,228 | 33,685 | 34,944 | 35,328 | 32,575 | 32,586 | 33,383 | 35,185 | 37,725 |
| 2013 | 37,271 | 36,057 | 33,254 | 30,689 | 30,437 | 34,059 | 33,975 | 31,464 | 27,277 | 25,450 | 26,003 | 27,073 |
| 2014 | 27,162 | 25,468 | 23,831 | 21,942 | 22,569 | 20,571 | 20,709 | 18,774 | 18,414 | 17,131 | 18,944 | 20,237 |
| 2015 | 20,570 | 18,822 | 17,443 | 16,809 | 16,626 | 16,938 | 16,634 | 17,968 | 19,154 | 18,008 | 17,299 | 18,103 |
| 2016 | 18,233 | 19,296 | 17,532 | 17,242 | 17,181 | 16,997 | 17,386 | 17,661 | 16,473 | 16,146 | 17,729 | 18,354 |
| 2017 | 18,584 | 16,735 | 14,500 | 14,816 | 15,592 | 15,708 | 16,082 | 16,870 | 14,131 | 15,840 | 16,990 | 16,758 |
| 2018 | 16,390 | 16,141 | 16,189 | 15,808 | 16,081 | 17,239 | 16,829 | 16,246 | 17,004 | 16,547 | 16,393 | 17,757 |
| 2019 | 20,068 | 17,164 | 15,483 | 15,070 | 15,500 | 15,492 | 15,457 | 15,898 | 15,382 | 16,015 | 16,791 | 17,798 |
| 2020 | 20,443 | 18,800 | 16,635 | 16,159 | 16,956 | 16,711 | 17,266 | 18,120 | 16,855 | 18,427 | 17,722 | 19,035 |
| 2021 | 16,376 | 14,617 | 14,581 | 14,906 | 14,724 | 12,437 | 13,244 | 12,990 | 13,560 | 12,902 | 12,045 | 12,302 |
| 2022 | 13,085 | 13,024 | 12,604 | 12,657 | 12,455 | 11,723 | 11,784 | 12,093 | 11,750 | 12,172 | 12,542 | 12,614 |
| 2023 | 11,471 | 12,428 | 10,488 | 11,181 | 12,261 | 12,816 | 10,769 | 11,523 | 11,719 | 11,329 | 12,416 | 13,802 |
| 2024 | 12,047 | 12,037 | 10,757 | 11,421 | 12,417 | 11,548 | ||||||
| - = No Data Reported; -- = Not Applicable; NA = Not Available; W = Withheld to avoid disclosure of individual company data. |
| Release Date: 8/30/2024 |
| Next Release Date: 9/30/2024 |