|
Download Data (XLS File) |
|
||||||||
|
||||||||
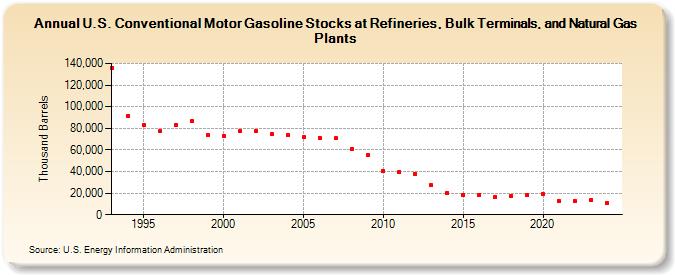
| U.S. Conventional Motor Gasoline Stocks at Refineries, Bulk Terminals, and Natural Gas Plants (Thousand Barrels) | ||||||||
| Decade | Year-0 | Year-1 | Year-2 | Year-3 | Year-4 | Year-5 | Year-6 | Year-7 | Year-8 | Year-9 |
|---|---|---|---|---|---|---|---|---|---|---|
| 1990's | 136,145 | 91,328 | 82,644 | 77,130 | 82,602 | 86,585 | 73,689 | |||
| 2000's | 72,945 | 77,253 | 77,426 | 74,449 | 73,710 | 71,802 | 71,402 | 70,660 | 61,030 | 54,890 |
| 2010's | 40,279 | 39,542 | 37,725 | 27,073 | 20,237 | 18,103 | 18,354 | 16,758 | 17,757 | 17,798 |
| 2020's | 19,035 | 12,302 | 12,614 | 13,696 |
| - = No Data Reported; -- = Not Applicable; NA = Not Available; W = Withheld to avoid disclosure of individual company data. |
| Release Date: 6/28/2024 |
| Next Release Date: 8/30/2024 |