|
Download Data (XLS File) |
|
||||||||
|
||||||||
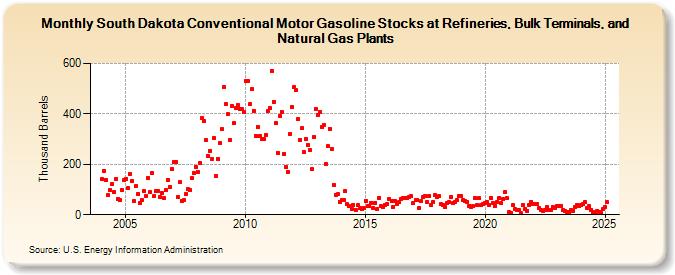
| South Dakota Conventional Motor Gasoline Stocks at Refineries, Bulk Terminals, and Natural Gas Plants (Thousand Barrels) | ||||||||
| Year | Jan | Feb | Mar | Apr | May | Jun | Jul | Aug | Sep | Oct | Nov | Dec |
|---|---|---|---|---|---|---|---|---|---|---|---|---|
| 2004 | 141 | 174 | 139 | 77 | 99 | 121 | 91 | 142 | 64 | 57 | 100 | 137 |
| 2005 | 143 | 106 | 162 | 134 | 53 | 114 | 83 | 46 | 57 | 93 | 74 | 147 |
| 2006 | 89 | 165 | 74 | 94 | 96 | 71 | 88 | 66 | 98 | 138 | 111 | 182 |
| 2007 | 210 | 209 | 71 | 128 | 56 | 57 | 82 | 101 | 98 | 145 | 166 | 191 |
| 2008 | 170 | 204 | 384 | 372 | 295 | 234 | 254 | 220 | 306 | 153 | 223 | 283 |
| 2009 | 341 | 506 | 439 | 398 | 298 | 433 | 363 | 422 | 435 | 420 | 419 | 406 |
| 2010 | 532 | 532 | 438 | 497 | 413 | 314 | 349 | 313 | 299 | 300 | 316 | 411 |
| 2011 | 422 | 572 | 449 | 363 | 246 | 391 | 409 | 241 | 188 | 171 | 321 | 428 |
| 2012 | 505 | 493 | 379 | 298 | 344 | 247 | 301 | 278 | 256 | 180 | 309 | 421 |
| 2013 | 395 | 406 | 347 | 354 | 202 | 272 | 342 | 259 | 119 | 79 | 81 | 52 |
| 2014 | 58 | 60 | 94 | 41 | 35 | 21 | 38 | 20 | 37 | 26 | 21 | 25 |
| 2015 | 56 | 33 | 36 | 48 | 28 | 48 | 24 | 68 | 33 | 32 | 40 | 42 |
| 2016 | 61 | 54 | 32 | 53 | 42 | 51 | 63 | 68 | 65 | 65 | 71 | 73 |
| 2017 | 48 | 57 | 58 | 27 | 54 | 69 | 75 | 51 | 74 | 39 | 52 | 77 |
| 2018 | 71 | 73 | 41 | 39 | 30 | 45 | 49 | 71 | 46 | 51 | 57 | 73 |
| 2019 | 74 | 59 | 54 | 51 | 36 | 32 | 33 | 66 | 37 | 65 | 39 | 42 |
| 2020 | 47 | 50 | 40 | 66 | 45 | 36 | 52 | 68 | 46 | 61 | 89 | 65 |
| 2021 | 12 | 7 | 37 | 22 | 18 | 17 | 5 | 37 | 22 | 15 | 37 | 52 |
| 2022 | 43 | 43 | 43 | 26 | 20 | 15 | 17 | 29 | 20 | 18 | 29 | 27 |
| 2023 | 33 | 34 | 35 | 19 | 16 | 10 | 11 | 17 | 16 | 29 | 40 | 33 |
| 2024 | 37 | |||||||||||
| - = No Data Reported; -- = Not Applicable; NA = Not Available; W = Withheld to avoid disclosure of individual company data. |
| Release Date: 3/29/2024 |
| Next Release Date: 4/30/2024 |