|
Download Data (XLS File) |
|
||||||||
|
||||||||
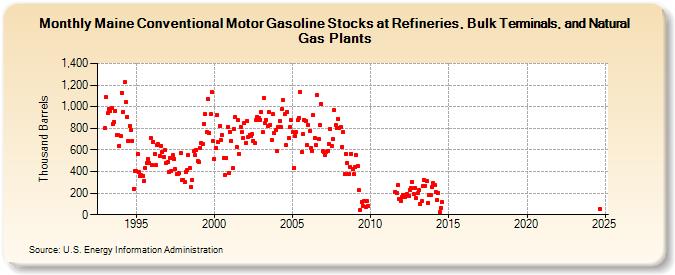
| Maine Conventional Motor Gasoline Stocks at Refineries, Bulk Terminals, and Natural Gas Plants (Thousand Barrels) | ||||||||
| Year | Jan | Feb | Mar | Apr | May | Jun | Jul | Aug | Sep | Oct | Nov | Dec |
|---|---|---|---|---|---|---|---|---|---|---|---|---|
| 1993 | 800 | 1,087 | 940 | 979 | 959 | 989 | 841 | 862 | 963 | 741 | 735 | 638 |
| 1994 | 733 | 1,131 | 952 | 1,224 | 1,043 | 909 | 686 | 824 | 784 | 687 | 241 | 403 |
| 1995 | 402 | 562 | 393 | 361 | 365 | 362 | 316 | 432 | 478 | 514 | 477 | 711 |
| 1996 | 460 | 676 | 564 | 458 | 643 | 652 | 544 | 638 | 579 | 536 | 600 | 479 |
| 1997 | 486 | 395 | 529 | 405 | 550 | 515 | 423 | 377 | 379 | 387 | 567 | 322 |
| 1998 | 324 | 304 | 398 | 412 | 550 | 429 | 260 | 323 | 587 | 551 | 602 | 495 |
| 1999 | 487 | 621 | 665 | 650 | 838 | 929 | 762 | 1,068 | 759 | 928 | 1,136 | 685 |
| 2000 | 515 | 620 | 927 | 677 | 820 | 691 | 737 | 526 | 370 | 524 | 811 | 382 |
| 2001 | 770 | 683 | 431 | 795 | 903 | 631 | 874 | 564 | 813 | 763 | 709 | 846 |
| 2002 | 666 | 866 | 717 | 736 | 727 | 744 | 686 | 665 | 877 | 905 | 896 | 880 |
| 2003 | 951 | 762 | 1,085 | 850 | 879 | 824 | 947 | 835 | 690 | 929 | 760 | 781 |
| 2004 | 592 | 811 | 867 | 809 | 975 | 1,059 | 929 | 643 | 952 | 711 | 812 | 876 |
| 2005 | 764 | 434 | 728 | 763 | 877 | 898 | 1,140 | 584 | 749 | 877 | 872 | 641 |
| 2006 | 834 | 777 | 615 | 591 | 920 | 713 | 643 | 1,104 | 699 | 832 | 1,027 | 586 |
| 2007 | 578 | 554 | 583 | 594 | 653 | 793 | 640 | 700 | 971 | 826 | 799 | 889 |
| 2008 | 800 | 814 | 627 | 765 | 376 | 564 | 479 | 381 | 445 | 565 | 425 | 374 |
| 2009 | 439 | 550 | 450 | 225 | 43 | 122 | 79 | 126 | 74 | 126 | 81 | |
| 2010 | 45 | |||||||||||
| 2011 | 211 | 203 | 271 | 150 | 130 | |||||||
| 2012 | 163 | 187 | 165 | 186 | 188 | 171 | 229 | 248 | 301 | 190 | 251 | 152 |
| 2013 | 198 | 229 | 98 | 126 | 263 | 324 | 270 | 310 | 112 | 183 | 183 | 254 |
| 2014 | 295 | 271 | 213 | 134 | 203 | 24 | 62 | 114 | ||||
| - = No Data Reported; -- = Not Applicable; NA = Not Available; W = Withheld to avoid disclosure of individual company data. |
| Release Date: 3/29/2024 |
| Next Release Date: 4/30/2024 |