|
Download Data (XLS File) |
|
||||||||
|
||||||||
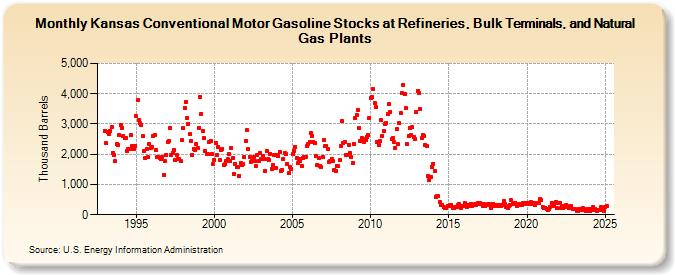
| Kansas Conventional Motor Gasoline Stocks at Refineries, Bulk Terminals, and Natural Gas Plants (Thousand Barrels) | ||||||||
| Year | Jan | Feb | Mar | Apr | May | Jun | Jul | Aug | Sep | Oct | Nov | Dec |
|---|---|---|---|---|---|---|---|---|---|---|---|---|
| 1993 | 2,767 | 2,362 | 2,728 | 2,658 | 2,771 | 2,912 | 2,056 | 1,967 | 1,766 | 2,333 | 2,297 | 2,631 |
| 1994 | 2,955 | 2,881 | 2,589 | 2,540 | 2,538 | 2,104 | 2,170 | 2,188 | 2,635 | 2,286 | 2,167 | 2,272 |
| 1995 | 3,262 | 3,779 | 3,120 | 3,020 | 2,971 | 2,594 | 2,113 | 1,877 | 2,159 | 1,892 | 2,331 | 2,195 |
| 1996 | 2,229 | 2,614 | 2,638 | 2,155 | 1,898 | 1,894 | 1,888 | 1,845 | 1,895 | 1,329 | 1,765 | 1,978 |
| 1997 | 2,398 | 2,434 | 2,883 | 1,987 | 2,051 | 2,156 | 1,798 | 1,972 | 1,852 | 1,828 | 1,767 | 2,468 |
| 1998 | 2,859 | 3,536 | 3,739 | 3,198 | 3,011 | 2,662 | 2,424 | 1,978 | 2,181 | 2,137 | 2,325 | 2,200 |
| 1999 | 2,880 | 3,902 | 3,344 | 2,777 | 2,534 | 2,104 | 2,020 | 2,012 | 2,393 | 2,438 | 1,991 | 1,665 |
| 2000 | 1,816 | 2,375 | 1,975 | 2,247 | 1,817 | 2,141 | 2,181 | 1,640 | 1,673 | 1,775 | 1,826 | 2,013 |
| 2001 | 1,763 | 2,202 | 1,861 | 1,339 | 1,680 | 1,565 | 1,585 | 1,290 | 1,703 | 1,639 | 1,683 | 1,916 |
| 2002 | 2,446 | 2,790 | 2,168 | 1,901 | 1,755 | 1,783 | 1,907 | 1,775 | 1,621 | 1,962 | 1,790 | 2,044 |
| 2003 | 1,848 | 1,944 | 1,853 | 1,456 | 2,108 | 1,831 | 1,806 | 2,012 | 1,508 | 1,639 | 1,960 | 1,550 |
| 2004 | 1,979 | 1,933 | 2,085 | 1,456 | 1,482 | 1,841 | 2,032 | 1,996 | 1,682 | 1,371 | 1,564 | 1,523 |
| 2005 | 2,003 | 2,120 | 2,238 | 1,869 | 1,713 | 1,852 | 1,776 | 1,616 | 1,863 | 1,898 | 1,901 | 2,257 |
| 2006 | 2,352 | 2,419 | 2,700 | 2,614 | 2,404 | 2,383 | 1,928 | 1,656 | 1,883 | 1,626 | 1,568 | 1,915 |
| 2007 | 2,466 | 2,275 | 2,277 | 2,184 | 1,744 | 1,767 | 1,842 | 1,787 | 1,488 | 1,459 | 1,624 | 1,598 |
| 2008 | 1,803 | 2,264 | 3,084 | 2,371 | 2,403 | 1,977 | 1,968 | 2,316 | 2,030 | 1,896 | 1,699 | 2,347 |
| 2009 | 3,206 | 3,303 | 3,472 | 2,859 | 2,443 | 2,541 | 2,493 | 2,401 | 2,484 | 2,580 | 2,623 | 3,194 |
| 2010 | 3,861 | 3,889 | 4,146 | 3,680 | 3,567 | 2,419 | 2,294 | 2,430 | 3,130 | 2,616 | 2,752 | 2,995 |
| 2011 | 3,044 | 3,321 | 3,648 | 3,395 | 2,490 | 2,552 | 2,389 | 2,216 | 2,828 | 2,325 | 3,016 | 3,355 |
| 2012 | 4,013 | 4,292 | 3,986 | 3,524 | 2,338 | 2,600 | 2,874 | 2,621 | 2,898 | 2,582 | 2,500 | 3,401 |
| 2013 | 4,106 | 4,019 | 3,511 | 2,530 | 2,619 | 2,607 | 2,297 | 2,281 | 1,286 | 1,132 | 1,243 | 1,588 |
| 2014 | 1,689 | 1,440 | 593 | 607 | 609 | 418 | 326 | 324 | 249 | 228 | 235 | 286 |
| 2015 | 273 | 318 | 326 | 210 | 210 | 249 | 259 | 311 | 343 | 237 | 288 | 284 |
| 2016 | 381 | 302 | 265 | 307 | 294 | 359 | 300 | 323 | 341 | 327 | 378 | 344 |
| 2017 | 375 | 340 | 283 | 360 | 285 | 316 | 345 | 355 | 237 | 279 | 367 | 325 |
| 2018 | 279 | 334 | 273 | 330 | 290 | 308 | 458 | 342 | 255 | 219 | 275 | 327 |
| 2019 | 470 | 396 | 352 | 397 | 297 | 333 | 354 | 367 | 308 | 393 | 376 | 358 |
| 2020 | 392 | 357 | 403 | 411 | 342 | 377 | 309 | 402 | 401 | 382 | 535 | 486 |
| 2021 | 259 | 218 | 228 | 174 | 140 | 196 | 261 | 401 | 287 | 334 | 420 | 206 |
| 2022 | 376 | 376 | 214 | 300 | 212 | 265 | 337 | 301 | 208 | 256 | 273 | 203 |
| 2023 | 213 | 199 | 138 | 108 | 196 | 146 | 193 | 206 | 141 | 130 | 188 | 188 |
| 2024 | 137 | |||||||||||
| - = No Data Reported; -- = Not Applicable; NA = Not Available; W = Withheld to avoid disclosure of individual company data. |
| Release Date: 3/29/2024 |
| Next Release Date: 4/30/2024 |