|
Download Data (XLS File) |
|
||||||||
|
||||||||
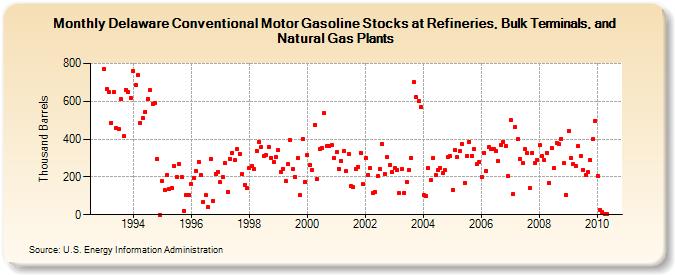
| Delaware Conventional Motor Gasoline Stocks at Refineries, Bulk Terminals, and Natural Gas Plants (Thousand Barrels) | ||||||||
| Year | Jan | Feb | Mar | Apr | May | Jun | Jul | Aug | Sep | Oct | Nov | Dec |
|---|---|---|---|---|---|---|---|---|---|---|---|---|
| 1993 | 771 | 663 | 647 | 487 | 648 | 459 | 456 | 610 | 414 | 662 | 649 | 617 |
| 1994 | 758 | 684 | 738 | 487 | 511 | 545 | 612 | 658 | 588 | 591 | 296 | 0 |
| 1995 | 176 | 132 | 210 | 134 | 140 | 258 | 199 | 267 | 199 | 22 | 103 | 105 |
| 1996 | 164 | 194 | 233 | 279 | 211 | 67 | 102 | 39 | 295 | 75 | 218 | 228 |
| 1997 | 171 | 199 | 272 | 122 | 296 | 329 | 288 | 346 | 323 | 216 | 158 | 141 |
| 1998 | 248 | 259 | 241 | 336 | 384 | 358 | 311 | 315 | 360 | 302 | 278 | 304 |
| 1999 | 342 | 226 | 244 | 177 | 268 | 394 | 241 | 200 | 300 | 104 | 398 | 174 |
| 2000 | 316 | 264 | 237 | 476 | 188 | 347 | 354 | 538 | 362 | 362 | 367 | 302 |
| 2001 | 330 | 244 | 285 | 337 | 230 | 323 | 151 | 145 | 244 | 253 | 329 | 161 |
| 2002 | 300 | 209 | 247 | 117 | 122 | 203 | 242 | 373 | 218 | 303 | 263 | 225 |
| 2003 | 246 | 236 | 114 | 242 | 117 | 175 | 236 | 302 | 701 | 621 | 599 | 569 |
| 2004 | 103 | 100 | 247 | 181 | 301 | 208 | 238 | 246 | 219 | 235 | 307 | 309 |
| 2005 | 131 | 341 | 303 | 336 | 374 | 168 | 313 | 385 | 311 | 345 | 266 | 279 |
| 2006 | 201 | 328 | 232 | 356 | 346 | 350 | 339 | 282 | 368 | 386 | 366 | 203 |
| 2007 | 501 | 109 | 463 | 401 | 295 | 271 | 346 | 326 | 142 | 329 | 273 | 292 |
| 2008 | 367 | 313 | 289 | 329 | 169 | 355 | 248 | 380 | 372 | 402 | 271 | 105 |
| 2009 | 444 | 301 | 268 | 257 | 364 | 309 | 237 | 211 | 224 | 289 | 398 | 498 |
| 2010 | 203 | 24 | 14 | 4 | 4 | |||||||
| - = No Data Reported; -- = Not Applicable; NA = Not Available; W = Withheld to avoid disclosure of individual company data. |
| Release Date: 6/28/2024 |
| Next Release Date: 7/31/2024 |