|
Download Data (XLS File) |
|
||||||||
|
||||||||
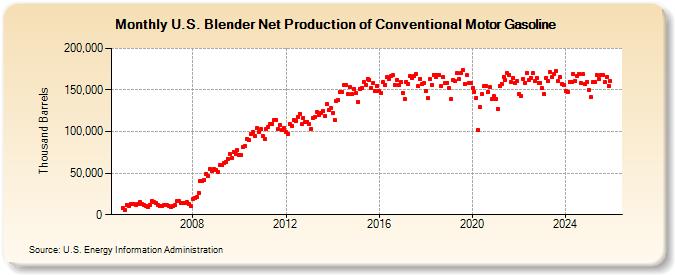
| U.S. Blender Net Production of Conventional Motor Gasoline (Thousand Barrels) | ||||||||
| Year | Jan | Feb | Mar | Apr | May | Jun | Jul | Aug | Sep | Oct | Nov | Dec |
|---|---|---|---|---|---|---|---|---|---|---|---|---|
| 2005 | 8,231 | 6,110 | 12,075 | 11,020 | 12,744 | 13,307 | 12,348 | 12,130 | 13,400 | 15,543 | 12,645 | 11,472 |
| 2006 | 10,308 | 9,178 | 12,234 | 16,970 | 15,515 | 13,608 | 11,676 | 10,926 | 10,233 | 11,274 | 11,117 | 11,123 |
| 2007 | 9,956 | 9,191 | 10,998 | 11,698 | 16,344 | 16,181 | 13,624 | 13,945 | 14,260 | 15,220 | 12,847 | 10,732 |
| 2008 | 18,578 | 20,394 | 21,242 | 26,547 | 39,974 | 40,225 | 42,058 | 49,277 | 46,436 | 54,678 | 52,820 | 54,555 |
| 2009 | 53,514 | 51,376 | 59,181 | 59,273 | 61,722 | 63,592 | 67,469 | 72,718 | 67,976 | 75,705 | 73,070 | 77,940 |
| 2010 | 71,905 | 71,608 | 81,978 | 82,841 | 91,403 | 89,366 | 97,580 | 99,504 | 94,854 | 104,223 | 99,832 | 102,657 |
| 2011 | 94,873 | 91,545 | 103,333 | 105,593 | 109,366 | 109,137 | 113,972 | 113,688 | 102,920 | 107,845 | 101,685 | 104,134 |
| 2012 | 99,624 | 97,233 | 109,166 | 107,238 | 114,267 | 112,318 | 117,253 | 121,495 | 108,737 | 116,698 | 111,935 | 111,809 |
| 2013 | 108,740 | 103,209 | 116,650 | 118,083 | 123,891 | 119,341 | 122,630 | 124,244 | 118,796 | 132,722 | 126,488 | 128,280 |
| 2014 | 122,677 | 113,980 | 136,233 | 137,751 | 147,446 | 147,844 | 156,461 | 155,748 | 144,754 | 152,999 | 144,601 | 151,560 |
| 2015 | 146,608 | 135,634 | 151,246 | 152,539 | 159,809 | 156,265 | 163,293 | 162,115 | 152,783 | 158,790 | 148,590 | 155,193 |
| 2016 | 148,887 | 146,514 | 159,255 | 156,343 | 165,064 | 162,761 | 166,541 | 167,628 | 156,481 | 162,465 | 155,732 | 160,158 |
| 2017 | 146,784 | 139,431 | 159,824 | 157,738 | 166,356 | 164,005 | 167,163 | 169,430 | 154,373 | 163,578 | 157,081 | 158,016 |
| 2018 | 148,722 | 139,991 | 162,768 | 156,462 | 168,396 | 165,317 | 167,793 | 168,385 | 154,583 | 165,497 | 158,390 | 158,942 |
| 2019 | 152,223 | 139,722 | 162,402 | 160,284 | 170,152 | 163,174 | 170,236 | 174,519 | 156,973 | 167,643 | 158,341 | 158,495 |
| 2020 | 152,039 | 147,652 | 140,402 | 102,070 | 129,037 | 144,819 | 154,542 | 154,624 | 147,378 | 153,255 | 138,937 | 142,388 |
| 2021 | 139,021 | 127,225 | 155,143 | 157,491 | 166,116 | 161,890 | 169,922 | 168,098 | 159,855 | 164,260 | 158,378 | 160,752 |
| 2022 | 145,480 | 143,103 | 163,702 | 158,867 | 170,611 | 162,495 | 164,854 | 170,016 | 160,319 | 164,801 | 158,871 | 158,903 |
| 2023 | 151,908 | 144,843 | 164,834 | 160,713 | 171,142 | 165,525 | 169,403 | 172,359 | 160,346 | 165,485 | 157,029 | 156,436 |
| 2024 | 148,172 | 147,351 | 159,647 | 159,551 | 169,291 | 160,448 | ||||||
| - = No Data Reported; -- = Not Applicable; NA = Not Available; W = Withheld to avoid disclosure of individual company data. |
| Release Date: 8/30/2024 |
| Next Release Date: 9/30/2024 |