|
Download Data (XLS File) |
|
||||||||
|
||||||||
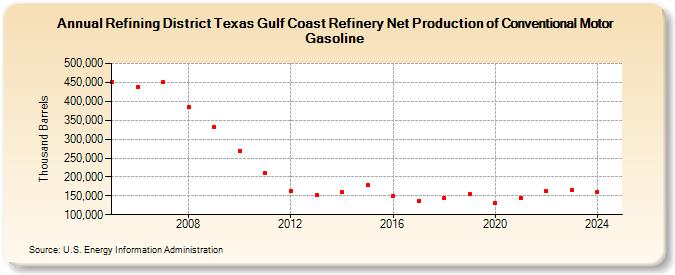
| Refining District Texas Gulf Coast Refinery Net Production of Conventional Motor Gasoline (Thousand Barrels) | ||||||||
| Decade | Year-0 | Year-1 | Year-2 | Year-3 | Year-4 | Year-5 | Year-6 | Year-7 | Year-8 | Year-9 |
|---|---|---|---|---|---|---|---|---|---|---|
| 2000's | 449,787 | 439,061 | 450,438 | 385,552 | 331,359 | |||||
| 2010's | 268,017 | 210,002 | 163,674 | 152,451 | 159,423 | 177,938 | 149,187 | 137,304 | 143,179 | 154,412 |
| 2020's | 131,965 | 145,340 | 163,687 | 165,338 |
| - = No Data Reported; -- = Not Applicable; NA = Not Available; W = Withheld to avoid disclosure of individual company data. |
| Release Date: 8/30/2024 |
| Next Release Date: 8/29/2025 |