|
Download Data (XLS File) |
|
||||||||
|
||||||||
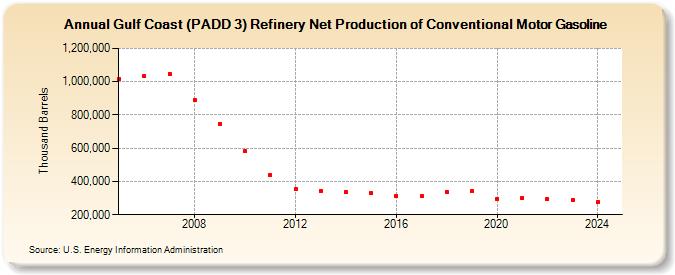
| Gulf Coast (PADD 3) Refinery Net Production of Conventional Motor Gasoline (Thousand Barrels) | ||||||||
| Decade | Year-0 | Year-1 | Year-2 | Year-3 | Year-4 | Year-5 | Year-6 | Year-7 | Year-8 | Year-9 |
|---|---|---|---|---|---|---|---|---|---|---|
| 2000's | 1,016,532 | 1,032,142 | 1,048,329 | 891,057 | 746,214 | |||||
| 2010's | 580,143 | 437,518 | 354,741 | 345,232 | 336,627 | 330,944 | 313,667 | 310,892 | 338,800 | 339,618 |
| 2020's | 296,042 | 301,140 | 292,067 | 290,817 |
| - = No Data Reported; -- = Not Applicable; NA = Not Available; W = Withheld to avoid disclosure of individual company data. |
| Release Date: 6/28/2024 |
| Next Release Date: 8/30/2024 |