|
Download Data (XLS File) |
|
||||||||
|
||||||||
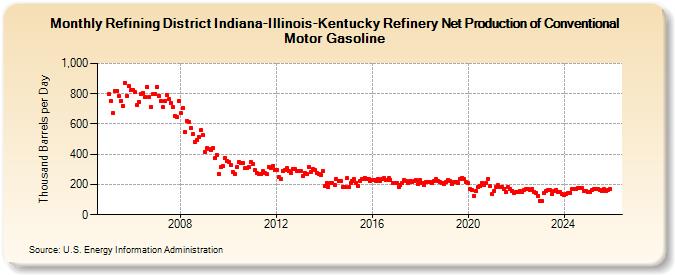
| Refining District Indiana-Illinois-Kentucky Refinery Net Production of Conventional Motor Gasoline (Thousand Barrels per Day) | ||||||||
| Year | Jan | Feb | Mar | Apr | May | Jun | Jul | Aug | Sep | Oct | Nov | Dec |
|---|---|---|---|---|---|---|---|---|---|---|---|---|
| 2005 | 797 | 753 | 671 | 817 | 821 | 785 | 755 | 721 | 873 | 787 | 849 | 822 |
| 2006 | 824 | 809 | 727 | 748 | 799 | 805 | 778 | 845 | 778 | 714 | 795 | 801 |
| 2007 | 844 | 788 | 751 | 712 | 750 | 790 | 763 | 739 | 711 | 654 | 644 | 749 |
| 2008 | 670 | 705 | 548 | 621 | 610 | 571 | 534 | 483 | 491 | 516 | 558 | 526 |
| 2009 | 415 | 438 | 437 | 426 | 439 | 376 | 397 | 271 | 315 | 321 | 372 | 354 |
| 2010 | 348 | 326 | 284 | 269 | 315 | 350 | 340 | 339 | 307 | 309 | 316 | 349 |
| 2011 | 338 | 297 | 273 | 268 | 268 | 286 | 279 | 266 | 316 | 311 | 324 | 296 |
| 2012 | 297 | 250 | 238 | 292 | 293 | 306 | 292 | 278 | 301 | 300 | 292 | 287 |
| 2013 | 291 | 253 | 277 | 272 | 316 | 281 | 302 | 296 | 278 | 267 | 261 | 288 |
| 2014 | 188 | 212 | 185 | 213 | 209 | 196 | 235 | 221 | 222 | 182 | 183 | 241 |
| 2015 | 180 | 209 | 221 | 236 | 210 | 188 | 224 | 239 | 246 | 239 | 237 | 223 |
| 2016 | 230 | 231 | 221 | 237 | 226 | 237 | 241 | 232 | 240 | 231 | 209 | 212 |
| 2017 | 213 | 186 | 194 | 207 | 228 | 221 | 210 | 224 | 218 | 221 | 227 | 205 |
| 2018 | 227 | 212 | 195 | 214 | 216 | 218 | 212 | 224 | 237 | 223 | 215 | 212 |
| 2019 | 206 | 217 | 228 | 220 | 201 | 215 | 219 | 209 | 234 | 245 | 233 | 217 |
| 2020 | 211 | 168 | 164 | 124 | 155 | 180 | 188 | 211 | 198 | 207 | 236 | 187 |
| 2021 | 140 | 159 | 185 | 194 | 184 | 184 | 172 | 147 | 184 | 172 | 159 | 142 |
| 2022 | 147 | 149 | 156 | 151 | 161 | 168 | 169 | 163 | 171 | 152 | 146 | 125 |
| 2023 | 91 | 92 | 143 | 157 | 162 | 161 | 137 | 157 | 164 | 153 | 149 | 134 |
| 2024 | 124 | |||||||||||
| - = No Data Reported; -- = Not Applicable; NA = Not Available; W = Withheld to avoid disclosure of individual company data. |
| Release Date: 3/29/2024 |
| Next Release Date: 4/30/2024 |