|
Download Data (XLS File) |
|
||||||||
|
||||||||
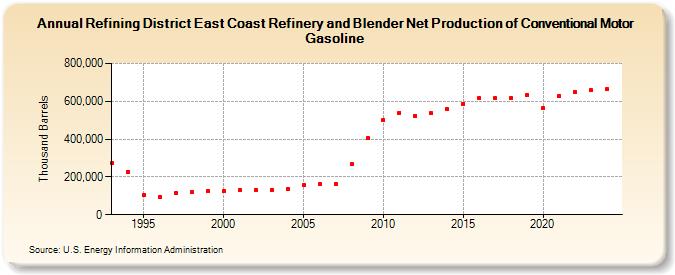
| Refining District East Coast Refinery and Blender Net Production of Conventional Motor Gasoline (Thousand Barrels) | ||||||||
| Decade | Year-0 | Year-1 | Year-2 | Year-3 | Year-4 | Year-5 | Year-6 | Year-7 | Year-8 | Year-9 |
|---|---|---|---|---|---|---|---|---|---|---|
| 1990's | 271,977 | 227,902 | 102,350 | 92,356 | 113,771 | 117,592 | 123,964 | |||
| 2000's | 123,103 | 129,803 | 131,257 | 132,469 | 133,756 | 158,364 | 160,038 | 162,579 | 266,229 | 405,360 |
| 2010's | 499,801 | 539,981 | 524,464 | 536,164 | 557,448 | 588,115 | 617,243 | 617,336 | 618,066 | 634,466 |
| 2020's | 562,850 | 628,150 | 648,867 | 656,613 |
| - = No Data Reported; -- = Not Applicable; NA = Not Available; W = Withheld to avoid disclosure of individual company data. |
| Release Date: 3/29/2024 |
| Next Release Date: 8/30/2024 |