|
Download Data (XLS File) |
|
||||||||
|
||||||||
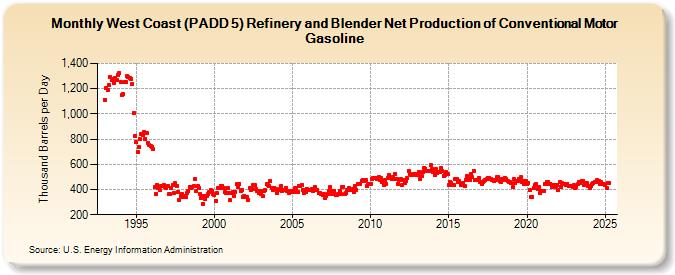
| West Coast (PADD 5) Refinery and Blender Net Production of Conventional Motor Gasoline (Thousand Barrels per Day) | ||||||||
| Year | Jan | Feb | Mar | Apr | May | Jun | Jul | Aug | Sep | Oct | Nov | Dec |
|---|---|---|---|---|---|---|---|---|---|---|---|---|
| 1993 | 1,114 | 1,206 | 1,193 | 1,228 | 1,292 | 1,269 | 1,274 | 1,243 | 1,288 | 1,270 | 1,311 | 1,324 |
| 1994 | 1,254 | 1,150 | 1,157 | 1,252 | 1,255 | 1,299 | 1,290 | 1,288 | 1,280 | 1,237 | 1,008 | 827 |
| 1995 | 774 | 695 | 739 | 802 | 839 | 836 | 856 | 804 | 850 | 772 | 751 | 746 |
| 1996 | 739 | 719 | 418 | 365 | 435 | 414 | 399 | 425 | 427 | 435 | 417 | 410 |
| 1997 | 428 | 362 | 362 | 414 | 439 | 374 | 448 | 430 | 379 | 320 | 346 | 366 |
| 1998 | 343 | 351 | 340 | 374 | 388 | 423 | 411 | 422 | 426 | 487 | 387 | 427 |
| 1999 | 414 | 363 | 335 | 287 | 352 | 327 | 345 | 364 | 384 | 399 | 388 | 362 |
| 2000 | 357 | 311 | 372 | 415 | 409 | 428 | 431 | 414 | 380 | 373 | 411 | 369 |
| 2001 | 314 | 370 | 378 | 345 | 383 | 443 | 421 | 447 | 387 | 398 | 344 | 349 |
| 2002 | 342 | 337 | 318 | 411 | 393 | 404 | 434 | 437 | 406 | 390 | 371 | 385 |
| 2003 | 361 | 346 | 387 | 395 | 441 | 436 | 428 | 467 | 413 | 393 | 415 | 401 |
| 2004 | 374 | 394 | 404 | 426 | 390 | 394 | 397 | 414 | 391 | 369 | 382 | 392 |
| 2005 | 378 | 381 | 413 | 413 | 383 | 426 | 428 | 437 | 399 | 375 | 383 | 408 |
| 2006 | 395 | 395 | 398 | 403 | 388 | 421 | 395 | 397 | 372 | 376 | 364 | 354 |
| 2007 | 365 | 336 | 351 | 367 | 386 | 417 | 364 | 390 | 390 | 359 | 356 | 368 |
| 2008 | 385 | 364 | 416 | 420 | 362 | 372 | 400 | 409 | 396 | 400 | 401 | 378 |
| 2009 | 429 | 399 | 442 | 446 | 446 | 470 | 478 | 469 | 477 | 426 | 440 | 446 |
| 2010 | 446 | 480 | 490 | 488 | 489 | 480 | 497 | 479 | 489 | 460 | 438 | 474 |
| 2011 | 443 | 492 | 513 | 498 | 480 | 502 | 483 | 527 | 487 | 445 | 477 | 482 |
| 2012 | 434 | 474 | 453 | 469 | 491 | 546 | 522 | 514 | 518 | 525 | 523 | 513 |
| 2013 | 512 | 540 | 486 | 508 | 540 | 574 | 563 | 549 | 544 | 550 | 593 | 565 |
| 2014 | 542 | 517 | 562 | 531 | 538 | 537 | 574 | 547 | 509 | 518 | 536 | 524 |
| 2015 | 437 | 459 | 453 | 433 | 434 | 484 | 483 | 461 | 471 | 439 | 443 | 454 |
| 2016 | 424 | 478 | 509 | 491 | 478 | 524 | 496 | 548 | 473 | 479 | 472 | 491 |
| 2017 | 461 | 441 | 458 | 467 | 473 | 486 | 492 | 492 | 484 | 478 | 473 | 471 |
| 2018 | 474 | 496 | 496 | 469 | 457 | 484 | 478 | 494 | 480 | 468 | 462 | 456 |
| 2019 | 450 | 417 | 481 | 451 | 466 | 469 | 484 | 496 | 463 | 470 | 446 | 467 |
| 2020 | 441 | 455 | 397 | 341 | 343 | 414 | 435 | 442 | 404 | 421 | 375 | 391 |
| 2021 | 389 | 386 | 442 | 457 | 458 | 441 | 446 | 423 | 436 | 438 | 422 | 439 |
| 2022 | 398 | 459 | 423 | 448 | 442 | 447 | 439 | 446 | 425 | 428 | 426 | 420 |
| 2023 | 432 | 414 | 422 | 440 | 458 | 454 | 463 | 465 | 436 | 450 | 452 | 426 |
| 2024 | 410 | 428 | 444 | 453 | ||||||||
| - = No Data Reported; -- = Not Applicable; NA = Not Available; W = Withheld to avoid disclosure of individual company data. |
| Release Date: 6/28/2024 |
| Next Release Date: 7/31/2024 |