|
Download Data (XLS File) |
|
||||||||
|
||||||||
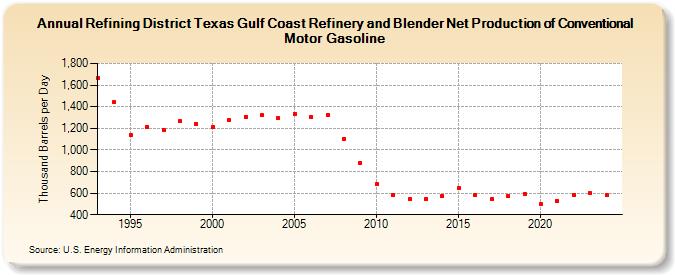
| Refining District Texas Gulf Coast Refinery and Blender Net Production of Conventional Motor Gasoline (Thousand Barrels per Day) | ||||||||
| Decade | Year-0 | Year-1 | Year-2 | Year-3 | Year-4 | Year-5 | Year-6 | Year-7 | Year-8 | Year-9 |
|---|---|---|---|---|---|---|---|---|---|---|
| 1990's | 1,666 | 1,441 | 1,140 | 1,211 | 1,188 | 1,264 | 1,241 | |||
| 2000's | 1,208 | 1,276 | 1,309 | 1,321 | 1,294 | 1,336 | 1,304 | 1,321 | 1,103 | 881 |
| 2010's | 682 | 583 | 544 | 546 | 569 | 643 | 585 | 541 | 571 | 596 |
| 2020's | 495 | 529 | 586 | 599 |
| - = No Data Reported; -- = Not Applicable; NA = Not Available; W = Withheld to avoid disclosure of individual company data. |
| Release Date: 3/29/2024 |
| Next Release Date: 8/30/2024 |