|
Download Data (XLS File) |
|
||||||||
|
||||||||
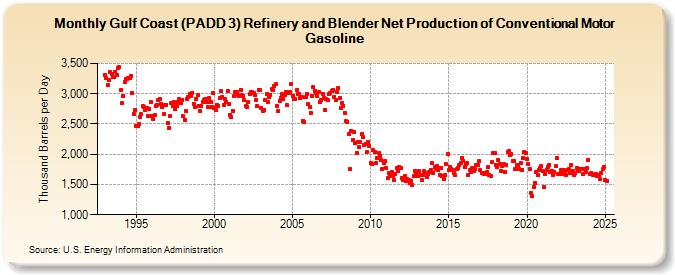
| Gulf Coast (PADD 3) Refinery and Blender Net Production of Conventional Motor Gasoline (Thousand Barrels per Day) | ||||||||
| Year | Jan | Feb | Mar | Apr | May | Jun | Jul | Aug | Sep | Oct | Nov | Dec |
|---|---|---|---|---|---|---|---|---|---|---|---|---|
| 1993 | 3,312 | 3,259 | 3,152 | 3,225 | 3,355 | 3,334 | 3,272 | 3,276 | 3,364 | 3,316 | 3,426 | 3,435 |
| 1994 | 3,063 | 2,847 | 2,961 | 3,189 | 3,249 | 3,242 | 3,253 | 3,264 | 3,300 | 3,011 | 2,664 | 2,723 |
| 1995 | 2,461 | 2,471 | 2,492 | 2,620 | 2,663 | 2,796 | 2,783 | 2,723 | 2,770 | 2,626 | 2,753 | 2,867 |
| 1996 | 2,629 | 2,583 | 2,646 | 2,796 | 2,818 | 2,904 | 2,905 | 2,831 | 2,777 | 2,666 | 2,817 | 2,821 |
| 1997 | 2,520 | 2,438 | 2,631 | 2,840 | 2,790 | 2,855 | 2,746 | 2,804 | 2,867 | 2,915 | 2,853 | 2,897 |
| 1998 | 2,626 | 2,572 | 2,713 | 2,921 | 2,949 | 2,989 | 2,970 | 3,017 | 2,837 | 2,773 | 2,916 | 2,975 |
| 1999 | 2,805 | 2,708 | 2,798 | 2,868 | 2,904 | 2,909 | 2,862 | 2,788 | 2,926 | 2,860 | 2,787 | 3,018 |
| 2000 | 2,761 | 2,737 | 2,815 | 2,798 | 2,937 | 3,039 | 2,952 | 2,816 | 2,919 | 2,868 | 3,048 | 2,837 |
| 2001 | 2,655 | 2,617 | 2,722 | 2,955 | 3,021 | 3,028 | 2,982 | 2,966 | 3,061 | 2,974 | 2,959 | 2,892 |
| 2002 | 2,790 | 2,785 | 2,867 | 2,997 | 3,033 | 3,022 | 3,009 | 2,971 | 2,903 | 2,799 | 3,068 | 3,064 |
| 2003 | 2,757 | 2,722 | 2,733 | 2,890 | 2,990 | 2,866 | 2,942 | 2,984 | 3,081 | 3,054 | 3,131 | 3,158 |
| 2004 | 2,796 | 2,708 | 2,888 | 2,927 | 2,991 | 2,909 | 2,976 | 3,036 | 2,807 | 3,007 | 3,027 | 3,157 |
| 2005 | 2,963 | 2,914 | 2,911 | 3,060 | 2,991 | 2,992 | 2,926 | 2,942 | 2,557 | 2,527 | 2,949 | 3,002 |
| 2006 | 2,832 | 2,786 | 2,683 | 2,960 | 3,114 | 3,050 | 3,019 | 2,966 | 3,023 | 2,858 | 2,900 | 3,003 |
| 2007 | 2,937 | 2,731 | 2,911 | 2,890 | 2,995 | 3,020 | 3,047 | 3,069 | 2,946 | 2,903 | 3,031 | 3,091 |
| 2008 | 2,930 | 2,771 | 2,843 | 2,799 | 2,689 | 2,552 | 2,534 | 2,332 | 1,758 | 2,389 | 2,243 | 2,368 |
| 2009 | 2,178 | 2,025 | 2,201 | 2,121 | 2,206 | 2,329 | 2,282 | 2,159 | 2,176 | 2,032 | 2,202 | 2,135 |
| 2010 | 1,856 | 1,832 | 2,068 | 2,041 | 1,863 | 1,942 | 2,021 | 1,973 | 1,900 | 1,762 | 1,851 | 1,881 |
| 2011 | 1,771 | 1,599 | 1,687 | 1,642 | 1,702 | 1,632 | 1,569 | 1,668 | 1,768 | 1,718 | 1,793 | 1,776 |
| 2012 | 1,610 | 1,580 | 1,637 | 1,563 | 1,583 | 1,579 | 1,517 | 1,550 | 1,494 | 1,632 | 1,718 | 1,697 |
| 2013 | 1,648 | 1,723 | 1,653 | 1,578 | 1,656 | 1,730 | 1,695 | 1,616 | 1,674 | 1,700 | 1,747 | 1,847 |
| 2014 | 1,697 | 1,788 | 1,760 | 1,803 | 1,744 | 1,656 | 1,780 | 1,645 | 1,587 | 1,652 | 1,834 | 2,006 |
| 2015 | 1,742 | 1,794 | 1,755 | 1,739 | 1,692 | 1,652 | 1,750 | 1,772 | 1,818 | 1,857 | 1,943 | 1,883 |
| 2016 | 1,794 | 1,835 | 1,863 | 1,664 | 1,732 | 1,711 | 1,776 | 1,727 | 1,761 | 1,829 | 1,830 | 1,883 |
| 2017 | 1,736 | 1,689 | 1,691 | 1,676 | 1,679 | 1,706 | 1,787 | 1,662 | 1,635 | 1,877 | 2,019 | 2,022 |
| 2018 | 1,824 | 1,793 | 1,900 | 1,833 | 1,728 | 1,810 | 1,836 | 1,713 | 1,825 | 2,034 | 2,056 | 1,979 |
| 2019 | 2,001 | 1,890 | 1,884 | 1,752 | 1,815 | 1,823 | 1,756 | 1,857 | 1,744 | 1,935 | 2,041 | 2,014 |
| 2020 | 1,922 | 1,836 | 1,751 | 1,359 | 1,302 | 1,464 | 1,532 | 1,698 | 1,653 | 1,736 | 1,773 | 1,798 |
| 2021 | 1,722 | 1,450 | 1,677 | 1,744 | 1,796 | 1,823 | 1,708 | 1,724 | 1,649 | 1,704 | 1,798 | 1,930 |
| 2022 | 1,673 | 1,668 | 1,744 | 1,678 | 1,747 | 1,717 | 1,664 | 1,734 | 1,750 | 1,691 | 1,814 | 1,719 |
| 2023 | 1,648 | 1,687 | 1,768 | 1,728 | 1,718 | 1,761 | 1,757 | 1,667 | 1,749 | 1,709 | 1,768 | 1,908 |
| 2024 | 1,666 | |||||||||||
| - = No Data Reported; -- = Not Applicable; NA = Not Available; W = Withheld to avoid disclosure of individual company data. |
| Release Date: 3/29/2024 |
| Next Release Date: 4/30/2024 |