|
Download Data (XLS File) |
|
||||||||
|
||||||||
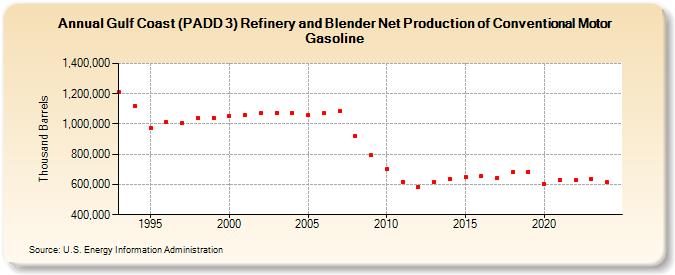
| Gulf Coast (PADD 3) Refinery and Blender Net Production of Conventional Motor Gasoline (Thousand Barrels) | ||||||||
| Decade | Year-0 | Year-1 | Year-2 | Year-3 | Year-4 | Year-5 | Year-6 | Year-7 | Year-8 | Year-9 |
|---|---|---|---|---|---|---|---|---|---|---|
| 1990's | 1,208,397 | 1,118,760 | 974,352 | 1,012,584 | 1,009,074 | 1,042,654 | 1,041,632 | |||
| 2000's | 1,053,041 | 1,059,867 | 1,074,166 | 1,074,389 | 1,075,000 | 1,056,471 | 1,070,707 | 1,082,612 | 921,482 | 792,504 |
| 2010's | 699,429 | 618,458 | 584,479 | 616,398 | 637,274 | 650,772 | 652,940 | 644,421 | 679,380 | 684,867 |
| 2020's | 604,622 | 631,094 | 626,573 | 634,906 |
| - = No Data Reported; -- = Not Applicable; NA = Not Available; W = Withheld to avoid disclosure of individual company data. |
| Release Date: 8/30/2024 |
| Next Release Date: 8/29/2025 |