|
Download Data (XLS File) |
|
||||||||
|
||||||||
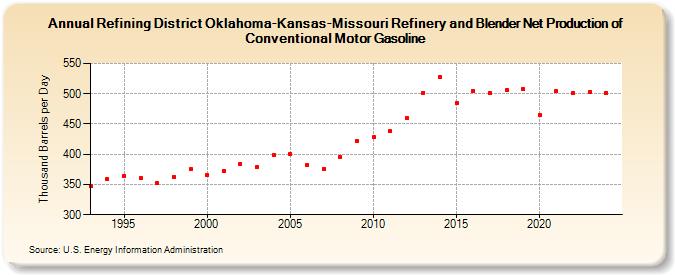
| Refining District Oklahoma-Kansas-Missouri Refinery and Blender Net Production of Conventional Motor Gasoline (Thousand Barrels per Day) | ||||||||
| Decade | Year-0 | Year-1 | Year-2 | Year-3 | Year-4 | Year-5 | Year-6 | Year-7 | Year-8 | Year-9 |
|---|---|---|---|---|---|---|---|---|---|---|
| 1990's | 347 | 359 | 364 | 360 | 352 | 363 | 375 | |||
| 2000's | 366 | 372 | 384 | 379 | 398 | 400 | 382 | 376 | 396 | 422 |
| 2010's | 428 | 438 | 460 | 502 | 527 | 485 | 505 | 501 | 506 | 507 |
| 2020's | 465 | 504 | 502 | 502 |
| - = No Data Reported; -- = Not Applicable; NA = Not Available; W = Withheld to avoid disclosure of individual company data. |
| Release Date: 3/29/2024 |
| Next Release Date: 8/30/2024 |