|
Download Data (XLS File) |
|
||||||||
|
||||||||
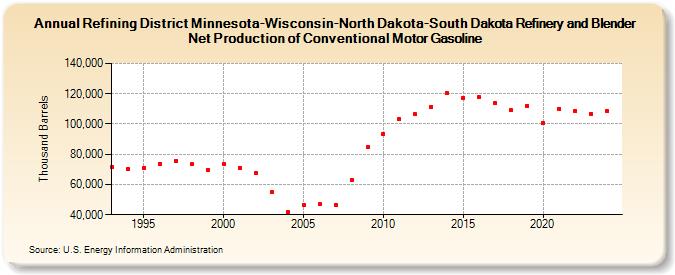
| Refining District Minnesota-Wisconsin-North Dakota-South Dakota Refinery and Blender Net Production of Conventional Motor Gasoline (Thousand Barrels) | ||||||||
| Decade | Year-0 | Year-1 | Year-2 | Year-3 | Year-4 | Year-5 | Year-6 | Year-7 | Year-8 | Year-9 |
|---|---|---|---|---|---|---|---|---|---|---|
| 1990's | 71,268 | 70,130 | 71,129 | 73,571 | 75,720 | 73,228 | 69,875 | |||
| 2000's | 73,246 | 71,074 | 67,258 | 54,946 | 41,647 | 46,573 | 46,812 | 46,620 | 62,827 | 84,571 |
| 2010's | 93,543 | 103,264 | 106,281 | 111,400 | 120,238 | 117,472 | 117,580 | 113,829 | 109,070 | 112,063 |
| 2020's | 100,529 | 110,139 | 108,749 | 106,644 |
| - = No Data Reported; -- = Not Applicable; NA = Not Available; W = Withheld to avoid disclosure of individual company data. |
| Release Date: 4/30/2024 |
| Next Release Date: 8/30/2024 |