|
Download Data (XLS File) |
|
||||||||
|
||||||||
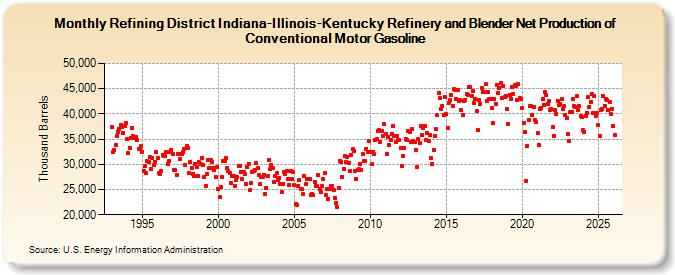
| Refining District Indiana-Illinois-Kentucky Refinery and Blender Net Production of Conventional Motor Gasoline (Thousand Barrels) | ||||||||
| Year | Jan | Feb | Mar | Apr | May | Jun | Jul | Aug | Sep | Oct | Nov | Dec |
|---|---|---|---|---|---|---|---|---|---|---|---|---|
| 1993 | 37,356 | 32,487 | 32,866 | 33,832 | 35,593 | 36,468 | 37,086 | 37,717 | 37,470 | 36,261 | 37,577 | 38,190 |
| 1994 | 34,935 | 32,169 | 33,286 | 35,301 | 37,222 | 35,614 | 35,198 | 35,458 | 34,793 | 33,119 | 33,005 | 33,573 |
| 1995 | 32,413 | 28,579 | 29,612 | 28,282 | 30,668 | 30,375 | 31,443 | 29,017 | 31,279 | 29,882 | 30,514 | 32,352 |
| 1996 | 31,280 | 28,342 | 27,991 | 28,630 | 31,883 | 31,738 | 31,630 | 32,483 | 30,057 | 30,681 | 32,504 | 32,918 |
| 1997 | 31,976 | 28,940 | 28,926 | 27,948 | 32,089 | 31,999 | 31,037 | 31,958 | 32,473 | 33,061 | 29,927 | 33,541 |
| 1998 | 33,275 | 28,213 | 30,442 | 29,300 | 28,094 | 27,763 | 30,113 | 29,399 | 27,676 | 30,365 | 30,081 | 31,306 |
| 1999 | 29,950 | 27,522 | 25,721 | 28,087 | 30,923 | 29,317 | 30,785 | 30,367 | 29,169 | 28,816 | 27,507 | 29,542 |
| 2000 | 25,127 | 23,539 | 25,561 | 27,529 | 30,557 | 30,642 | 31,156 | 29,276 | 28,607 | 28,201 | 26,318 | 27,723 |
| 2001 | 27,740 | 25,670 | 26,927 | 27,386 | 29,735 | 29,717 | 28,567 | 27,158 | 28,488 | 28,052 | 26,051 | 29,382 |
| 2002 | 30,144 | 24,820 | 26,368 | 28,473 | 28,663 | 28,906 | 30,211 | 29,217 | 27,804 | 26,132 | 27,445 | 27,565 |
| 2003 | 27,952 | 24,080 | 25,397 | 27,763 | 30,864 | 29,019 | 29,805 | 29,288 | 26,538 | 27,633 | 28,246 | 26,931 |
| 2004 | 27,370 | 26,027 | 24,459 | 26,143 | 28,393 | 28,101 | 28,740 | 27,123 | 25,973 | 28,690 | 27,141 | 28,483 |
| 2005 | 25,824 | 22,167 | 21,983 | 25,726 | 26,907 | 25,087 | 25,031 | 24,042 | 27,679 | 25,996 | 27,051 | 27,172 |
| 2006 | 27,057 | 23,994 | 24,044 | 23,992 | 26,453 | 25,753 | 25,715 | 27,877 | 25,004 | 24,453 | 25,612 | 27,027 |
| 2007 | 28,218 | 23,866 | 25,179 | 23,173 | 25,132 | 25,667 | 25,651 | 24,974 | 23,275 | 22,355 | 21,447 | 25,377 |
| 2008 | 30,752 | 30,415 | 27,465 | 29,036 | 31,667 | 30,507 | 31,542 | 30,171 | 28,693 | 31,840 | 32,985 | 32,670 |
| 2009 | 28,708 | 27,133 | 28,794 | 28,994 | 30,071 | 28,918 | 32,095 | 30,695 | 30,740 | 33,106 | 32,501 | 34,709 |
| 2010 | 32,416 | 30,006 | 32,370 | 32,076 | 34,869 | 35,007 | 36,657 | 36,733 | 34,356 | 36,555 | 35,654 | 37,897 |
| 2011 | 36,103 | 32,131 | 35,411 | 33,750 | 34,765 | 36,094 | 37,576 | 35,574 | 34,505 | 35,569 | 34,791 | 34,786 |
| 2012 | 33,321 | 29,627 | 31,579 | 33,288 | 34,997 | 34,746 | 36,603 | 36,412 | 34,338 | 37,048 | 34,627 | 34,426 |
| 2013 | 32,870 | 29,492 | 34,963 | 34,200 | 37,531 | 35,807 | 37,242 | 37,586 | 34,910 | 36,288 | 34,558 | 35,855 |
| 2014 | 31,298 | 30,016 | 32,902 | 35,639 | 36,914 | 39,733 | 44,067 | 43,095 | 41,031 | 41,541 | 39,727 | 43,416 |
| 2015 | 39,886 | 37,233 | 42,221 | 42,724 | 43,695 | 41,502 | 44,954 | 44,755 | 42,881 | 44,799 | 42,542 | 42,751 |
| 2016 | 40,719 | 39,689 | 42,578 | 42,848 | 43,949 | 43,825 | 45,345 | 45,247 | 43,530 | 44,454 | 42,127 | 42,987 |
| 2017 | 40,551 | 36,853 | 42,837 | 41,994 | 45,158 | 44,301 | 44,286 | 45,872 | 42,482 | 44,276 | 42,935 | 42,929 |
| 2018 | 41,210 | 38,171 | 42,951 | 42,048 | 45,739 | 44,114 | 45,148 | 46,060 | 43,076 | 45,550 | 43,314 | 43,581 |
| 2019 | 40,985 | 38,061 | 43,821 | 43,044 | 45,392 | 43,979 | 45,646 | 45,544 | 42,772 | 45,832 | 43,139 | 42,864 |
| 2020 | 41,091 | 38,257 | 36,370 | 26,593 | 33,665 | 38,845 | 41,530 | 41,575 | 39,820 | 41,455 | 38,877 | 38,365 |
| 2021 | 36,129 | 33,764 | 41,061 | 41,169 | 43,020 | 41,814 | 44,329 | 43,744 | 42,035 | 42,529 | 40,788 | 41,018 |
| 2022 | 37,321 | 35,698 | 40,756 | 40,009 | 42,628 | 41,691 | 41,970 | 42,903 | 40,981 | 41,544 | 39,694 | 39,175 |
| 2023 | 35,959 | 34,592 | 40,305 | 40,454 | 43,053 | 41,605 | 41,415 | 43,513 | 40,831 | 41,509 | 39,612 | 39,301 |
| 2024 | 36,268 | |||||||||||
| - = No Data Reported; -- = Not Applicable; NA = Not Available; W = Withheld to avoid disclosure of individual company data. |
| Release Date: 3/29/2024 |
| Next Release Date: 4/30/2024 |