|
Download Data (XLS File) |
|
||||||||
|
||||||||
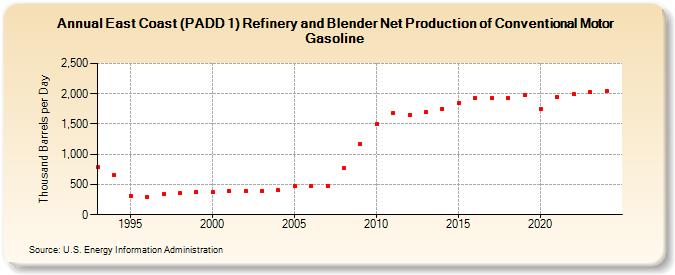
| East Coast (PADD 1) Refinery and Blender Net Production of Conventional Motor Gasoline (Thousand Barrels per Day) | ||||||||
| Decade | Year-0 | Year-1 | Year-2 | Year-3 | Year-4 | Year-5 | Year-6 | Year-7 | Year-8 | Year-9 |
|---|---|---|---|---|---|---|---|---|---|---|
| 1990's | 783 | 658 | 317 | 288 | 346 | 358 | 374 | |||
| 2000's | 368 | 388 | 394 | 400 | 402 | 471 | 476 | 480 | 765 | 1,167 |
| 2010's | 1,493 | 1,687 | 1,653 | 1,692 | 1,755 | 1,850 | 1,927 | 1,930 | 1,929 | 1,979 |
| 2020's | 1,746 | 1,945 | 1,996 | 2,022 |
| - = No Data Reported; -- = Not Applicable; NA = Not Available; W = Withheld to avoid disclosure of individual company data. |
| Release Date: 3/29/2024 |
| Next Release Date: 8/30/2024 |