|
Download Data (XLS File) |
|
||||||||
|
||||||||
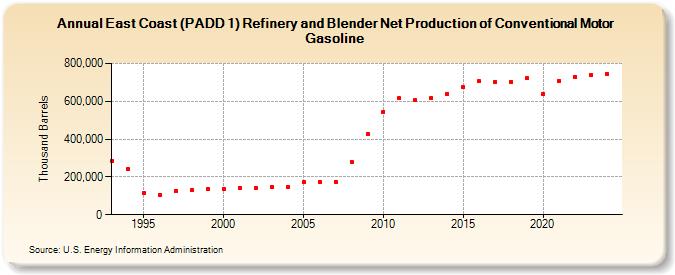
| East Coast (PADD 1) Refinery and Blender Net Production of Conventional Motor Gasoline (Thousand Barrels) | ||||||||
| Decade | Year-0 | Year-1 | Year-2 | Year-3 | Year-4 | Year-5 | Year-6 | Year-7 | Year-8 | Year-9 |
|---|---|---|---|---|---|---|---|---|---|---|
| 1990's | 285,612 | 240,222 | 115,531 | 105,522 | 126,118 | 130,569 | 136,649 | |||
| 2000's | 134,859 | 141,720 | 143,778 | 146,111 | 147,042 | 172,021 | 173,846 | 175,121 | 279,986 | 426,093 |
| 2010's | 544,926 | 615,670 | 605,047 | 617,409 | 640,655 | 675,080 | 705,392 | 704,384 | 704,073 | 722,285 |
| 2020's | 639,136 | 709,854 | 728,622 | 739,513 |
| - = No Data Reported; -- = Not Applicable; NA = Not Available; W = Withheld to avoid disclosure of individual company data. |
| Release Date: 8/30/2024 |
| Next Release Date: 8/29/2025 |