|
Download Data (XLS File) |
|
||||||||
|
||||||||
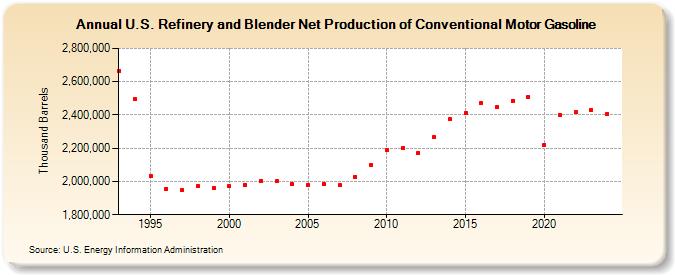
| U.S. Refinery and Blender Net Production of Conventional Motor Gasoline (Thousand Barrels) | ||||||||
| Decade | Year-0 | Year-1 | Year-2 | Year-3 | Year-4 | Year-5 | Year-6 | Year-7 | Year-8 | Year-9 |
|---|---|---|---|---|---|---|---|---|---|---|
| 1990's | 2,665,980 | 2,496,932 | 2,034,900 | 1,955,869 | 1,947,851 | 1,974,102 | 1,959,987 | |||
| 2000's | 1,970,563 | 1,980,305 | 2,004,769 | 2,000,098 | 1,984,306 | 1,977,993 | 1,983,825 | 1,976,949 | 2,028,715 | 2,100,194 |
| 2010's | 2,191,662 | 2,202,234 | 2,170,313 | 2,265,066 | 2,374,158 | 2,411,886 | 2,471,490 | 2,446,019 | 2,485,456 | 2,508,285 |
| 2020's | 2,221,755 | 2,400,262 | 2,415,530 | 2,428,792 |
| - = No Data Reported; -- = Not Applicable; NA = Not Available; W = Withheld to avoid disclosure of individual company data. |
| Release Date: 3/29/2024 |
| Next Release Date: 8/30/2024 |