|
Download Data (XLS File) |
|
||||||||
|
||||||||
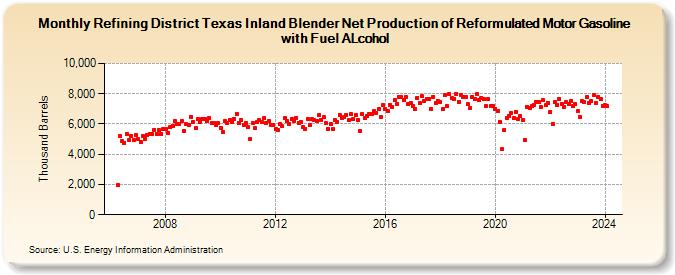
| Refining District Texas Inland Blender Net Production of Reformulated Motor Gasoline with Fuel ALcohol (Thousand Barrels) | ||||||||
| Year | Jan | Feb | Mar | Apr | May | Jun | Jul | Aug | Sep | Oct | Nov | Dec |
|---|---|---|---|---|---|---|---|---|---|---|---|---|
| 2006 | 1,943 | 5,185 | 4,851 | 4,762 | 5,346 | 4,924 | 5,192 | 4,970 | 5,270 | |||
| 2007 | 4,978 | 4,820 | 5,187 | 5,027 | 5,303 | 5,333 | 5,327 | 5,629 | 5,347 | 5,574 | 5,349 | 5,639 |
| 2008 | 5,653 | 5,434 | 5,783 | 5,889 | 6,187 | 6,018 | 6,000 | 6,178 | 5,528 | 6,007 | 5,946 | 6,464 |
| 2009 | 6,104 | 5,722 | 6,315 | 6,140 | 6,302 | 6,343 | 6,213 | 6,391 | 6,051 | 6,078 | 5,914 | 6,052 |
| 2010 | 5,766 | 5,446 | 6,223 | 6,079 | 6,286 | 6,149 | 6,336 | 6,688 | 6,082 | 6,246 | 5,945 | 6,059 |
| 2011 | 5,771 | 5,007 | 6,092 | 5,715 | 6,133 | 6,248 | 6,162 | 6,369 | 6,095 | 6,186 | 5,903 | 5,944 |
| 2012 | 5,638 | 5,592 | 6,020 | 5,838 | 6,386 | 6,168 | 6,030 | 6,306 | 6,186 | 6,408 | 6,082 | 6,108 |
| 2013 | 5,777 | 5,693 | 6,301 | 5,914 | 6,326 | 6,261 | 6,202 | 6,583 | 6,236 | 6,437 | 6,057 | 5,687 |
| 2014 | 6,001 | 5,647 | 6,263 | 6,162 | 6,614 | 6,396 | 6,434 | 6,624 | 6,269 | 6,632 | 6,325 | 6,564 |
| 2015 | 6,294 | 5,534 | 6,665 | 6,384 | 6,510 | 6,655 | 6,664 | 6,834 | 6,730 | 7,005 | 6,463 | 7,242 |
| 2016 | 6,981 | 6,841 | 7,257 | 7,115 | 7,564 | 7,328 | 7,786 | 7,779 | 7,615 | 7,784 | 7,306 | 7,398 |
| 2017 | 7,200 | 6,982 | 7,743 | 7,362 | 7,823 | 7,520 | 7,641 | 7,659 | 6,988 | 7,791 | 7,388 | 7,499 |
| 2018 | 7,421 | 6,995 | 7,900 | 7,172 | 7,977 | 7,706 | 7,654 | 8,007 | 7,470 | 7,907 | 7,757 | 7,804 |
| 2019 | 7,313 | 7,036 | 7,806 | 7,633 | 7,982 | 7,571 | 7,736 | 7,627 | 7,163 | 7,648 | 7,178 | 7,192 |
| 2020 | 7,008 | 6,863 | 6,159 | 4,324 | 5,633 | 6,387 | 6,515 | 6,717 | 6,402 | 6,805 | 6,302 | 6,524 |
| 2021 | 6,251 | 4,934 | 7,138 | 7,050 | 7,190 | 7,285 | 7,466 | 7,472 | 7,150 | 7,567 | 7,223 | 7,402 |
| 2022 | 6,809 | 5,982 | 7,452 | 7,286 | 7,664 | 7,329 | 7,139 | 7,441 | 7,311 | 7,541 | 7,177 | 7,307 |
| 2023 | 6,864 | 6,486 | 7,511 | 7,421 | 7,765 | 7,388 | 7,520 | 7,917 | 7,386 | 7,806 | 7,648 | 7,205 |
| 2024 | 7,229 | |||||||||||
| - = No Data Reported; -- = Not Applicable; NA = Not Available; W = Withheld to avoid disclosure of individual company data. |
| Release Date: 3/29/2024 |
| Next Release Date: 4/30/2024 |