|
Download Data (XLS File) |
|
||||||||
|
||||||||
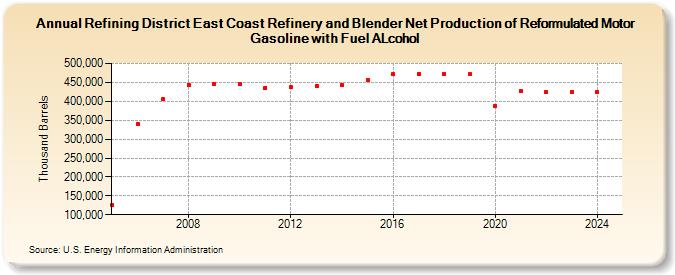
| Refining District East Coast Refinery and Blender Net Production of Reformulated Motor Gasoline with Fuel ALcohol (Thousand Barrels) | ||||||||
| Decade | Year-0 | Year-1 | Year-2 | Year-3 | Year-4 | Year-5 | Year-6 | Year-7 | Year-8 | Year-9 |
|---|---|---|---|---|---|---|---|---|---|---|
| 2000's | 126,154 | 340,754 | 405,067 | 443,226 | 446,140 | |||||
| 2010's | 444,709 | 435,902 | 436,577 | 439,815 | 442,555 | 455,987 | 472,093 | 471,626 | 473,119 | 471,396 |
| 2020's | 387,907 | 427,164 | 423,928 | 426,371 |
| - = No Data Reported; -- = Not Applicable; NA = Not Available; W = Withheld to avoid disclosure of individual company data. |
| Release Date: 3/29/2024 |
| Next Release Date: 8/30/2024 |