|
Download Data (XLS File) |
|
||||||||
|
||||||||
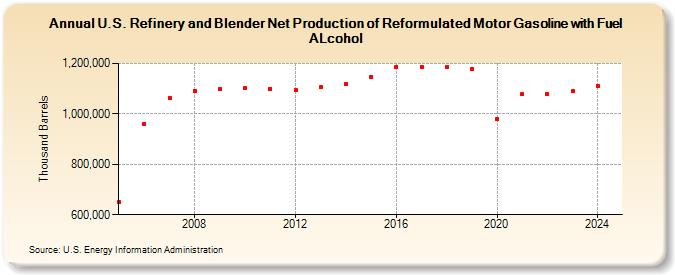
| U.S. Refinery and Blender Net Production of Reformulated Motor Gasoline with Fuel ALcohol (Thousand Barrels) | ||||||||
| Decade | Year-0 | Year-1 | Year-2 | Year-3 | Year-4 | Year-5 | Year-6 | Year-7 | Year-8 | Year-9 |
|---|---|---|---|---|---|---|---|---|---|---|
| 2000's | 648,648 | 960,489 | 1,063,598 | 1,092,304 | 1,099,355 | |||||
| 2010's | 1,101,847 | 1,100,673 | 1,096,709 | 1,105,394 | 1,119,066 | 1,148,231 | 1,186,532 | 1,187,104 | 1,186,677 | 1,176,452 |
| 2020's | 977,791 | 1,077,706 | 1,077,038 | 1,090,708 |
| - = No Data Reported; -- = Not Applicable; NA = Not Available; W = Withheld to avoid disclosure of individual company data. |
| Release Date: 3/29/2024 |
| Next Release Date: 8/30/2024 |