|
Download Data (XLS File) |
|
||||||||
|
||||||||
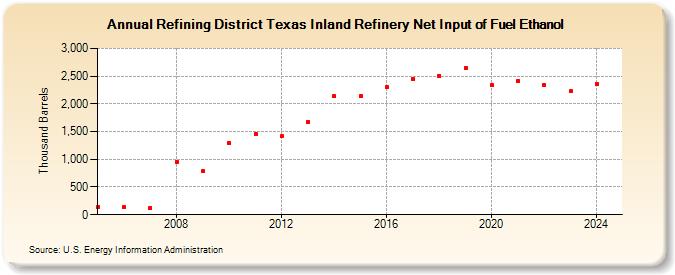
| Refining District Texas Inland Refinery Net Input of Fuel Ethanol (Thousand Barrels) | ||||||||
| Decade | Year-0 | Year-1 | Year-2 | Year-3 | Year-4 | Year-5 | Year-6 | Year-7 | Year-8 | Year-9 |
|---|---|---|---|---|---|---|---|---|---|---|
| 2000's | 145 | 131 | 124 | 956 | 784 | |||||
| 2010's | 1,291 | 1,452 | 1,414 | 1,670 | 2,137 | 2,138 | 2,295 | 2,448 | 2,506 | 2,654 |
| 2020's | 2,336 | 2,419 | 2,337 | 2,226 |
| - = No Data Reported; -- = Not Applicable; NA = Not Available; W = Withheld to avoid disclosure of individual company data. |
| Release Date: 3/29/2024 |
| Next Release Date: 8/30/2024 |
Referring Pages: