|
Download Data (XLS File) |
|
||||||||
|
||||||||
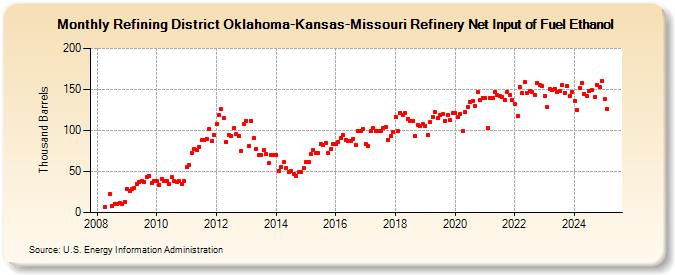
| Refining District Oklahoma-Kansas-Missouri Refinery Net Input of Fuel Ethanol (Thousand Barrels) | ||||||||
| Year | Jan | Feb | Mar | Apr | May | Jun | Jul | Aug | Sep | Oct | Nov | Dec |
|---|---|---|---|---|---|---|---|---|---|---|---|---|
| 2008 | 7 | 23 | 8 | 11 | 11 | 12 | 11 | 13 | ||||
| 2009 | 29 | 26 | 29 | 30 | 35 | 37 | 38 | 37 | 43 | 45 | 36 | 38 |
| 2010 | 38 | 34 | 41 | 39 | 39 | 35 | 43 | 38 | 37 | 38 | 35 | 38 |
| 2011 | 55 | 58 | 73 | 77 | 76 | 80 | 88 | 89 | 90 | 102 | 87 | 95 |
| 2012 | 108 | 119 | 126 | 115 | 86 | 94 | 93 | 103 | 96 | 93 | 75 | 108 |
| 2013 | 112 | 81 | 112 | 91 | 78 | 70 | 70 | 76 | 71 | 60 | 70 | 70 |
| 2014 | 70 | 51 | 56 | 61 | 54 | 49 | 51 | 47 | 45 | 49 | 50 | 54 |
| 2015 | 61 | 62 | 71 | 76 | 73 | 72 | 84 | 82 | 85 | 72 | 78 | 83 |
| 2016 | 84 | 86 | 91 | 95 | 89 | 87 | 87 | 90 | 82 | 99 | 99 | 102 |
| 2017 | 84 | 81 | 99 | 103 | 99 | 99 | 99 | 103 | 104 | 89 | 93 | 98 |
| 2018 | 117 | 99 | 121 | 119 | 121 | 114 | 112 | 112 | 93 | 107 | 106 | 108 |
| 2019 | 106 | 95 | 110 | 117 | 123 | 115 | 119 | 120 | 112 | 119 | 113 | 121 |
| 2020 | 121 | 116 | 120 | 99 | 122 | 129 | 135 | 136 | 130 | 147 | 137 | 140 |
| 2021 | 139 | 103 | 140 | 140 | 147 | 143 | 142 | 141 | 137 | 147 | 143 | 137 |
| 2022 | 132 | 118 | 153 | 146 | 159 | 146 | 148 | 147 | 143 | 158 | 155 | 154 |
| 2023 | 142 | 128 | 150 | 149 | 151 | 147 | 148 | 156 | 146 | 154 | 142 | 147 |
| 2024 | 136 | 125 | 152 | 158 | ||||||||
| - = No Data Reported; -- = Not Applicable; NA = Not Available; W = Withheld to avoid disclosure of individual company data. |
| Release Date: 6/28/2024 |
| Next Release Date: 7/31/2024 |