|
Download Data (XLS File) |
|
||||||||
|
||||||||
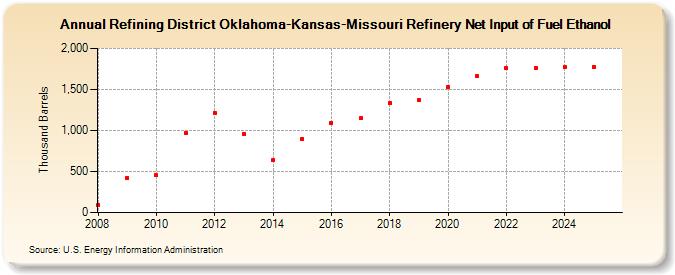
| Refining District Oklahoma-Kansas-Missouri Refinery Net Input of Fuel Ethanol (Thousand Barrels) | ||||||||
| Decade | Year-0 | Year-1 | Year-2 | Year-3 | Year-4 | Year-5 | Year-6 | Year-7 | Year-8 | Year-9 |
|---|---|---|---|---|---|---|---|---|---|---|
| 2000's | 96 | 423 | ||||||||
| 2010's | 455 | 970 | 1,216 | 961 | 637 | 899 | 1,091 | 1,151 | 1,329 | 1,370 |
| 2020's | 1,532 | 1,659 | 1,759 | 1,760 |
| - = No Data Reported; -- = Not Applicable; NA = Not Available; W = Withheld to avoid disclosure of individual company data. |
| Release Date: 8/30/2024 |
| Next Release Date: 8/29/2025 |