|
Download Data (XLS File) |
|
||||||||
|
||||||||
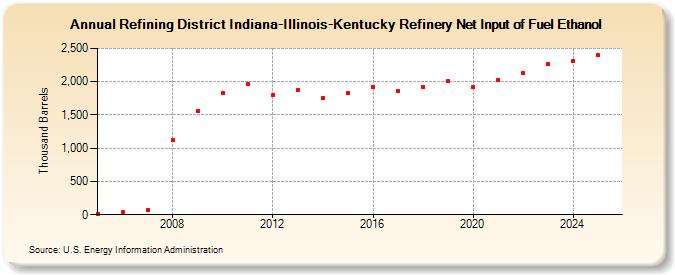
| Refining District Indiana-Illinois-Kentucky Refinery Net Input of Fuel Ethanol (Thousand Barrels) | ||||||||
| Decade | Year-0 | Year-1 | Year-2 | Year-3 | Year-4 | Year-5 | Year-6 | Year-7 | Year-8 | Year-9 |
|---|---|---|---|---|---|---|---|---|---|---|
| 2000's | 14 | 35 | 66 | 1,118 | 1,565 | |||||
| 2010's | 1,830 | 1,959 | 1,793 | 1,876 | 1,750 | 1,826 | 1,923 | 1,856 | 1,926 | 2,016 |
| 2020's | 1,913 | 2,028 | 2,131 | 2,259 |
| - = No Data Reported; -- = Not Applicable; NA = Not Available; W = Withheld to avoid disclosure of individual company data. |
| Release Date: 3/29/2024 |
| Next Release Date: 8/30/2024 |