|
Download Data (XLS File) |
|
||||||||
|
||||||||
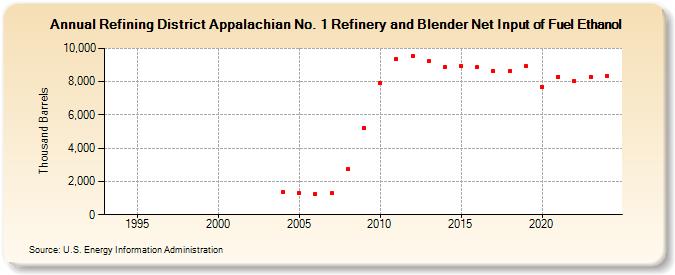
| Refining District Appalachian No. 1 Refinery and Blender Net Input of Fuel Ethanol (Thousand Barrels) | ||||||||
| Decade | Year-0 | Year-1 | Year-2 | Year-3 | Year-4 | Year-5 | Year-6 | Year-7 | Year-8 | Year-9 |
|---|---|---|---|---|---|---|---|---|---|---|
| 1990's | W | W | W | W | W | W | W | |||
| 2000's | W | W | W | W | 1,352 | 1,285 | 1,254 | 1,281 | 2,749 | 5,220 |
| 2010's | 7,936 | 9,358 | 9,542 | 9,223 | 8,888 | 8,952 | 8,866 | 8,628 | 8,635 | 8,917 |
| 2020's | 7,696 | 8,295 | 8,044 | 8,239 |
| - = No Data Reported; -- = Not Applicable; NA = Not Available; W = Withheld to avoid disclosure of individual company data. |
| Release Date: 4/30/2024 |
| Next Release Date: 8/30/2024 |